
FLOAT Energy Optimiser: Lower Carbon, Stable Costs Amid Market Tightness
Following April’s best result for this year, May 2025 brought another strong month for optimisation. Some low negative power prices were recorded in the month and FLOAT’s real-time optimiser continued to deliver improvements — giving a lower cost than May 2024 and reducing carbon intensity to its lowest point this year.
If you missed our April update, you can catch up here to see how FLOAT delivered £74/MWh hydrogen production costs and reduced carbon intensity in April 2025.
If you’d like to learn more about how we’ve built our optimiser to deliver these benefits, visit this blog post.
What Happened in May?
Unlike earlier in the year where extreme weather or supply shocks drove volatility, May was shaped by more persistent structural factors:
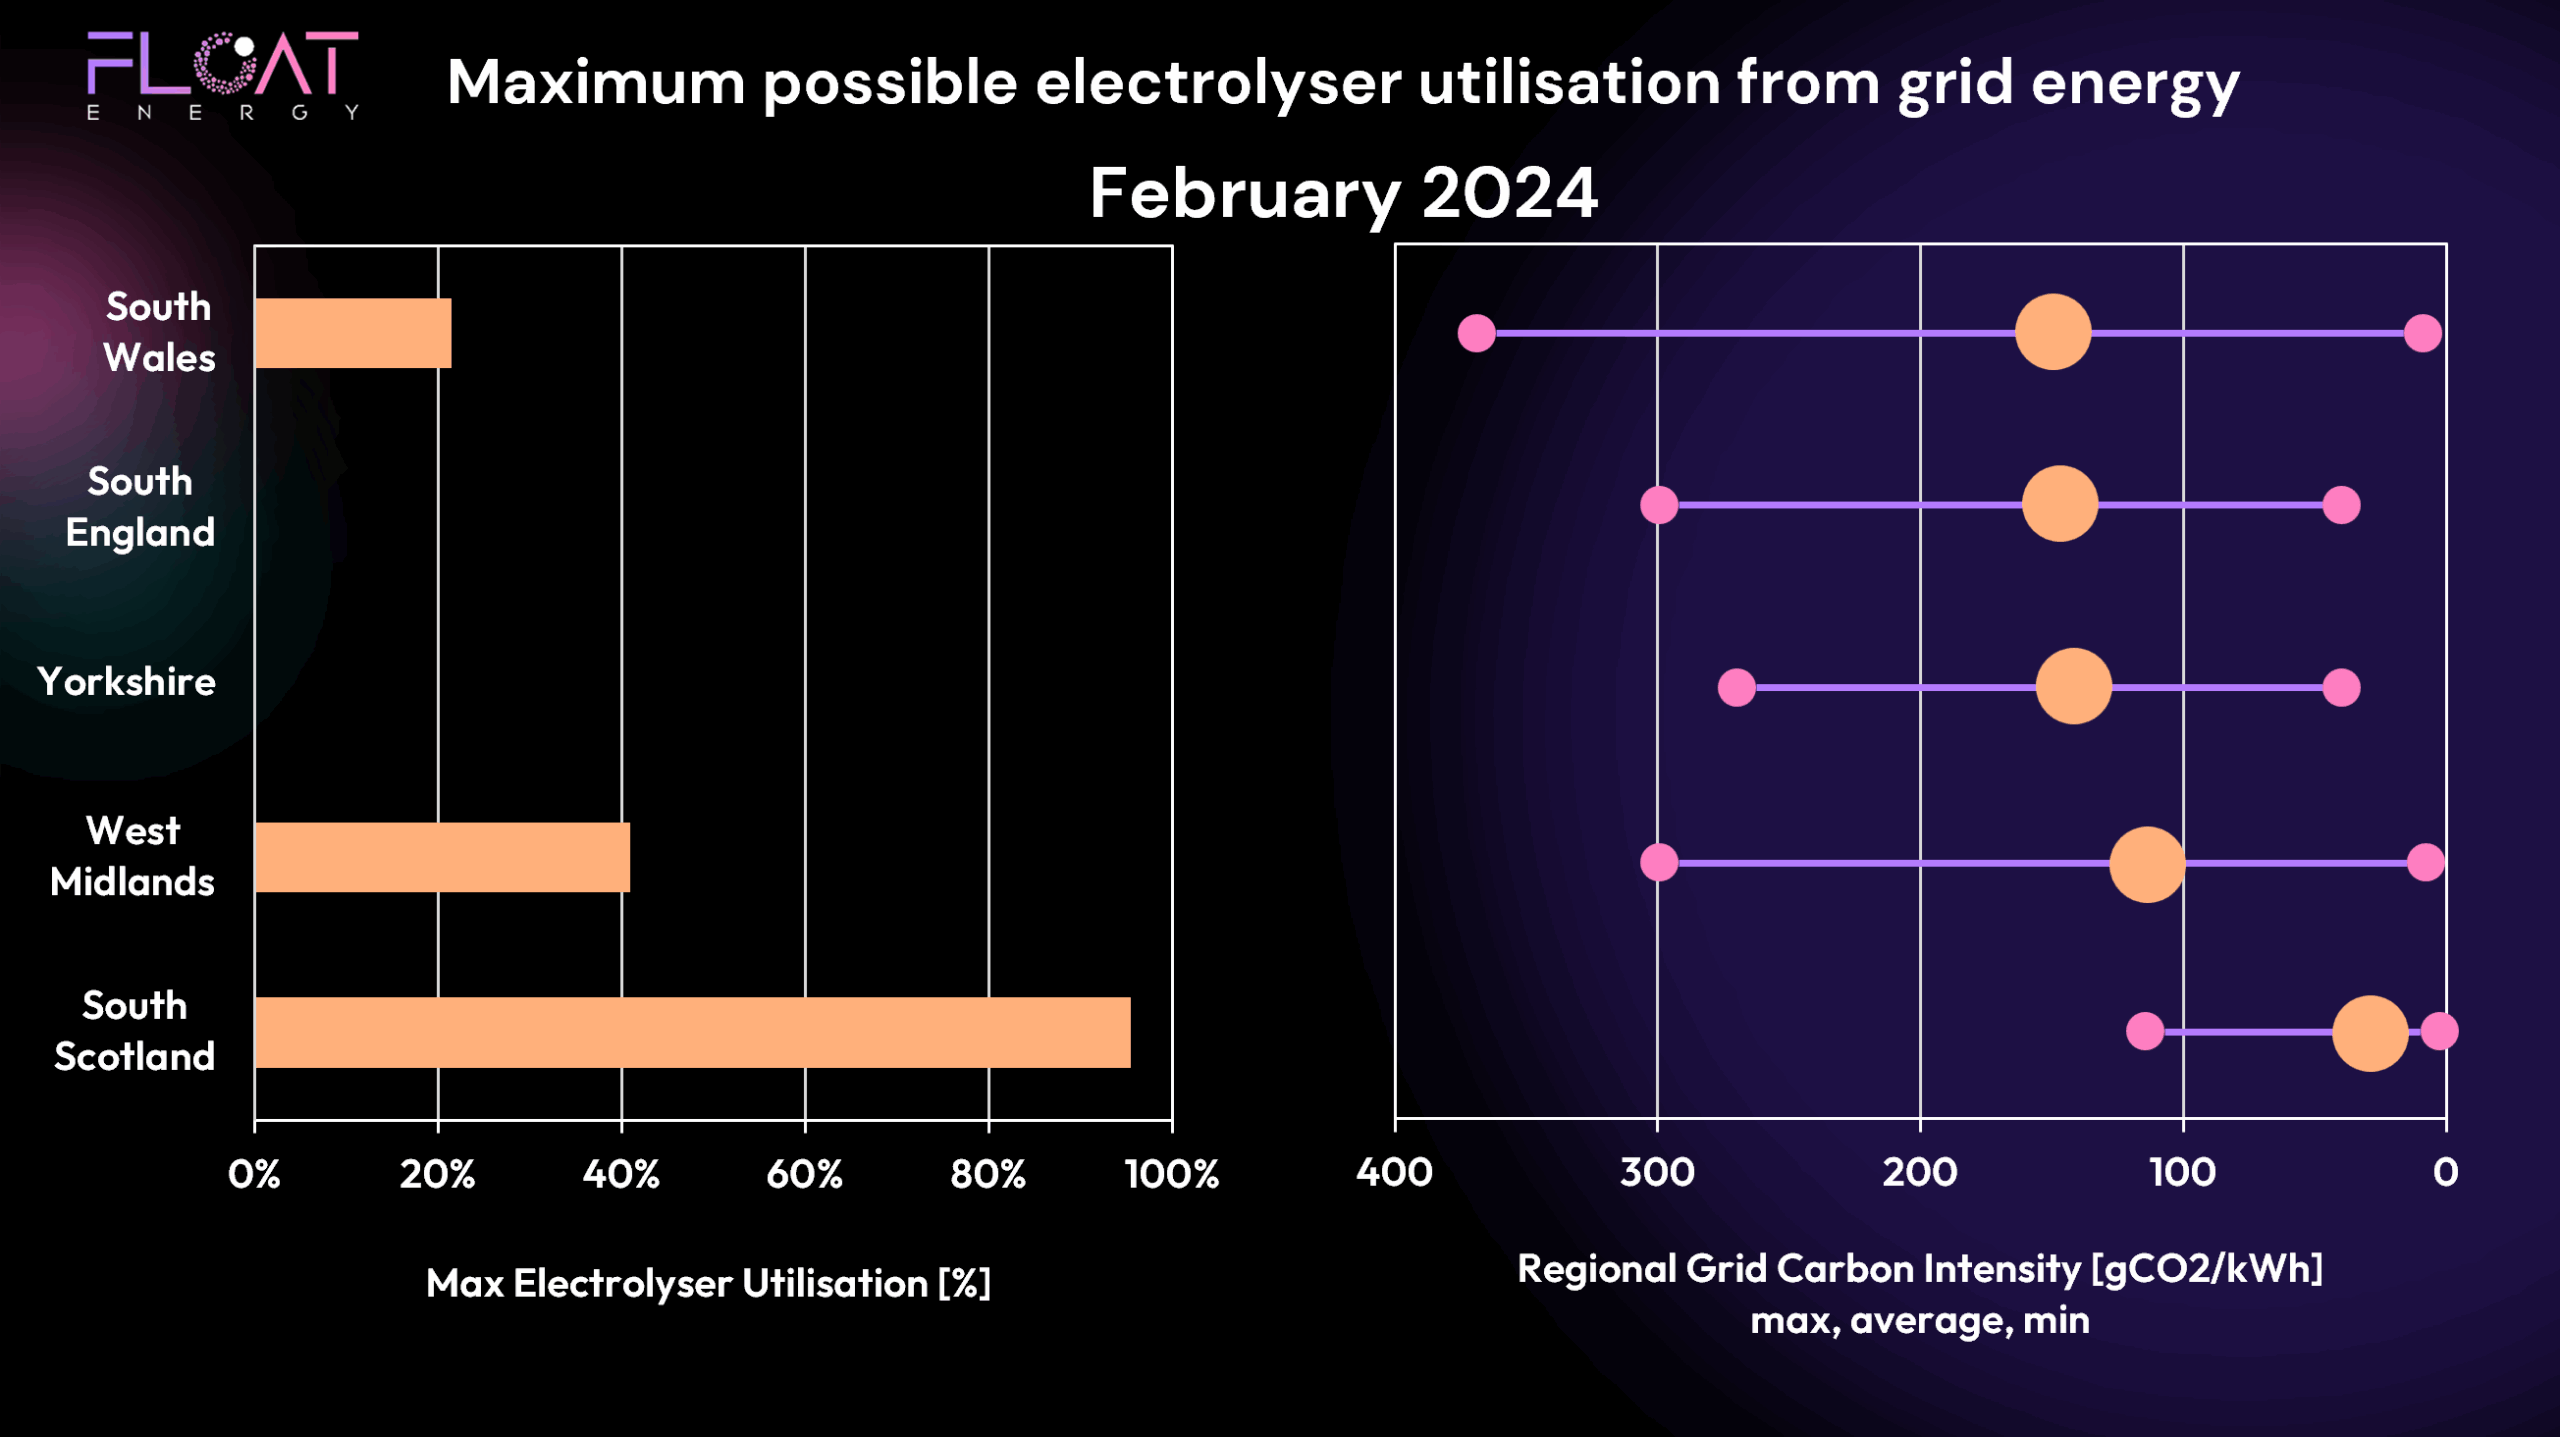
🔵 Strong Renewables
After a variable April, May saw stronger periods of wind output, particularly in the second half of the month. This resulted in some extreme negative prices and improved grid carbon intensity.
📈 Overall Power Prices Remained Elevated
Despite better renewables, gas remains the marginal price-setter most of the time. With European storage injections ramping up and LNG cargoes tightening, gas prices edged higher — keeping wholesale power prices firm.
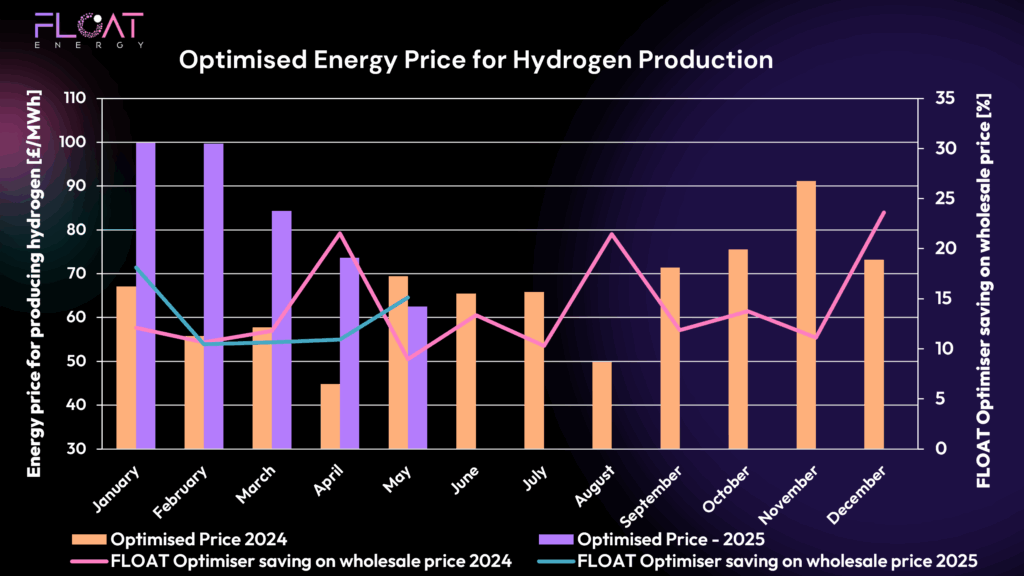
However, strong renewables that forced negative pricing gave rise to energy periods at up to -£40/MWh. Although average prices were high, the optimiser capitalised on the high price spread
⚡ System Balancing Costs Stayed High
National Grid’s balancing actions remained frequent and expensive, with flexibility services still playing a critical role. This kept system prices stubbornly elevated during key periods.
FLOAT Optimiser Results – May 2025 Performance
💷 Energy Cost Performance
FLOAT’s real-time optimiser delivered an average hydrogen production cost of just under £65/MWh in May. This reflects the reality of a market where prices remained structurally high despite improved renewable output.
The optimiser continued to protect producers from the worst volatility, scheduling production to capture lower-cost hours where possible — maintaining performance below broader market averages.
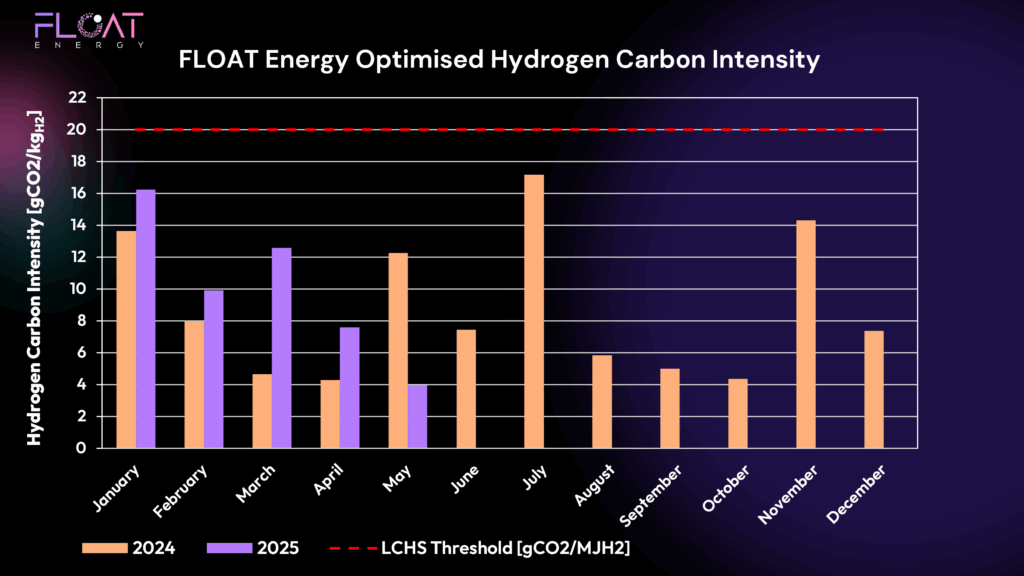
📉 Carbon Intensity Performance
Carbon intensity improved to 4 gCO₂/MJH2 in May, the lowest level so far in 2025.
This was driven by:
Stronger renewable generation periods, especially wind
FLOAT’s optimiser targeting cleaner grid windows effectively
Hydrogen production remains well within the UK Low Carbon Hydrogen Standard (LCHS) threshold of 20 gCO₂/MJH2.
PPAs, Trading & Real-Time Optimisation
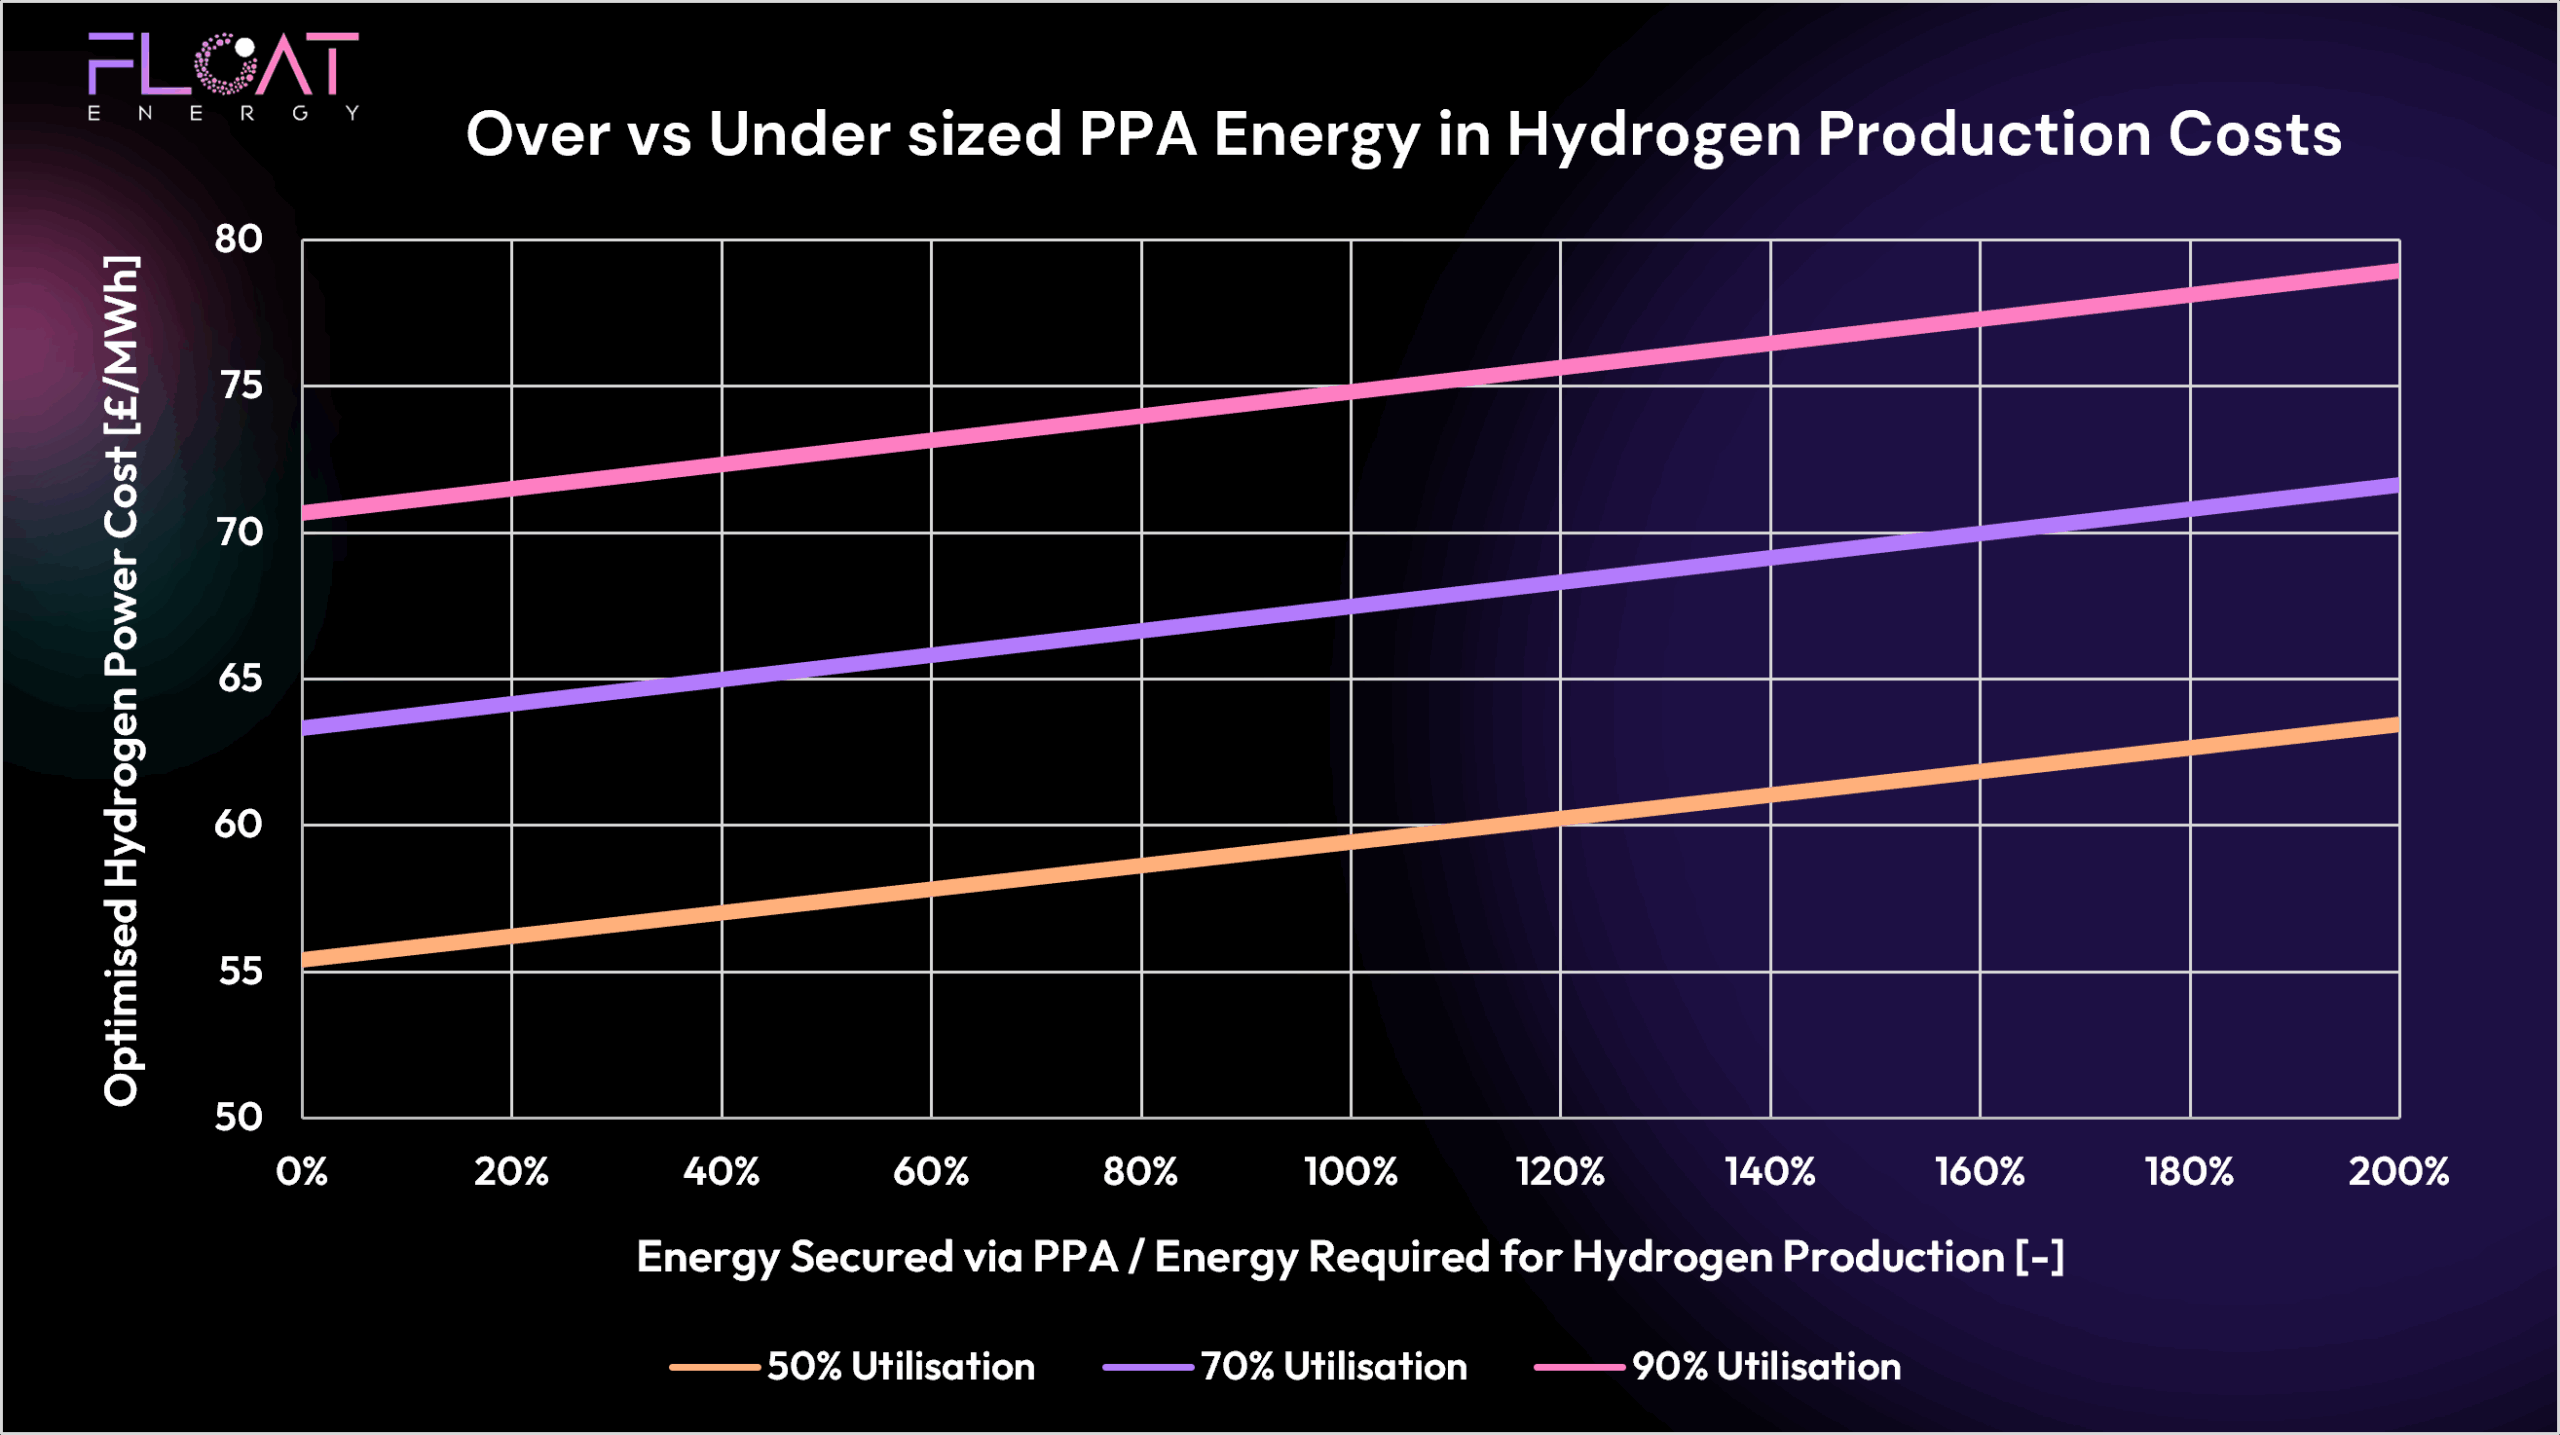
While these monthly results focus on grid-exposed optimisation, FLOAT recognises that PPAs remain a critical part of a resilient strategy:
Securing long-term price certainty for bankability
Supporting compliance through dedicated renewable supply
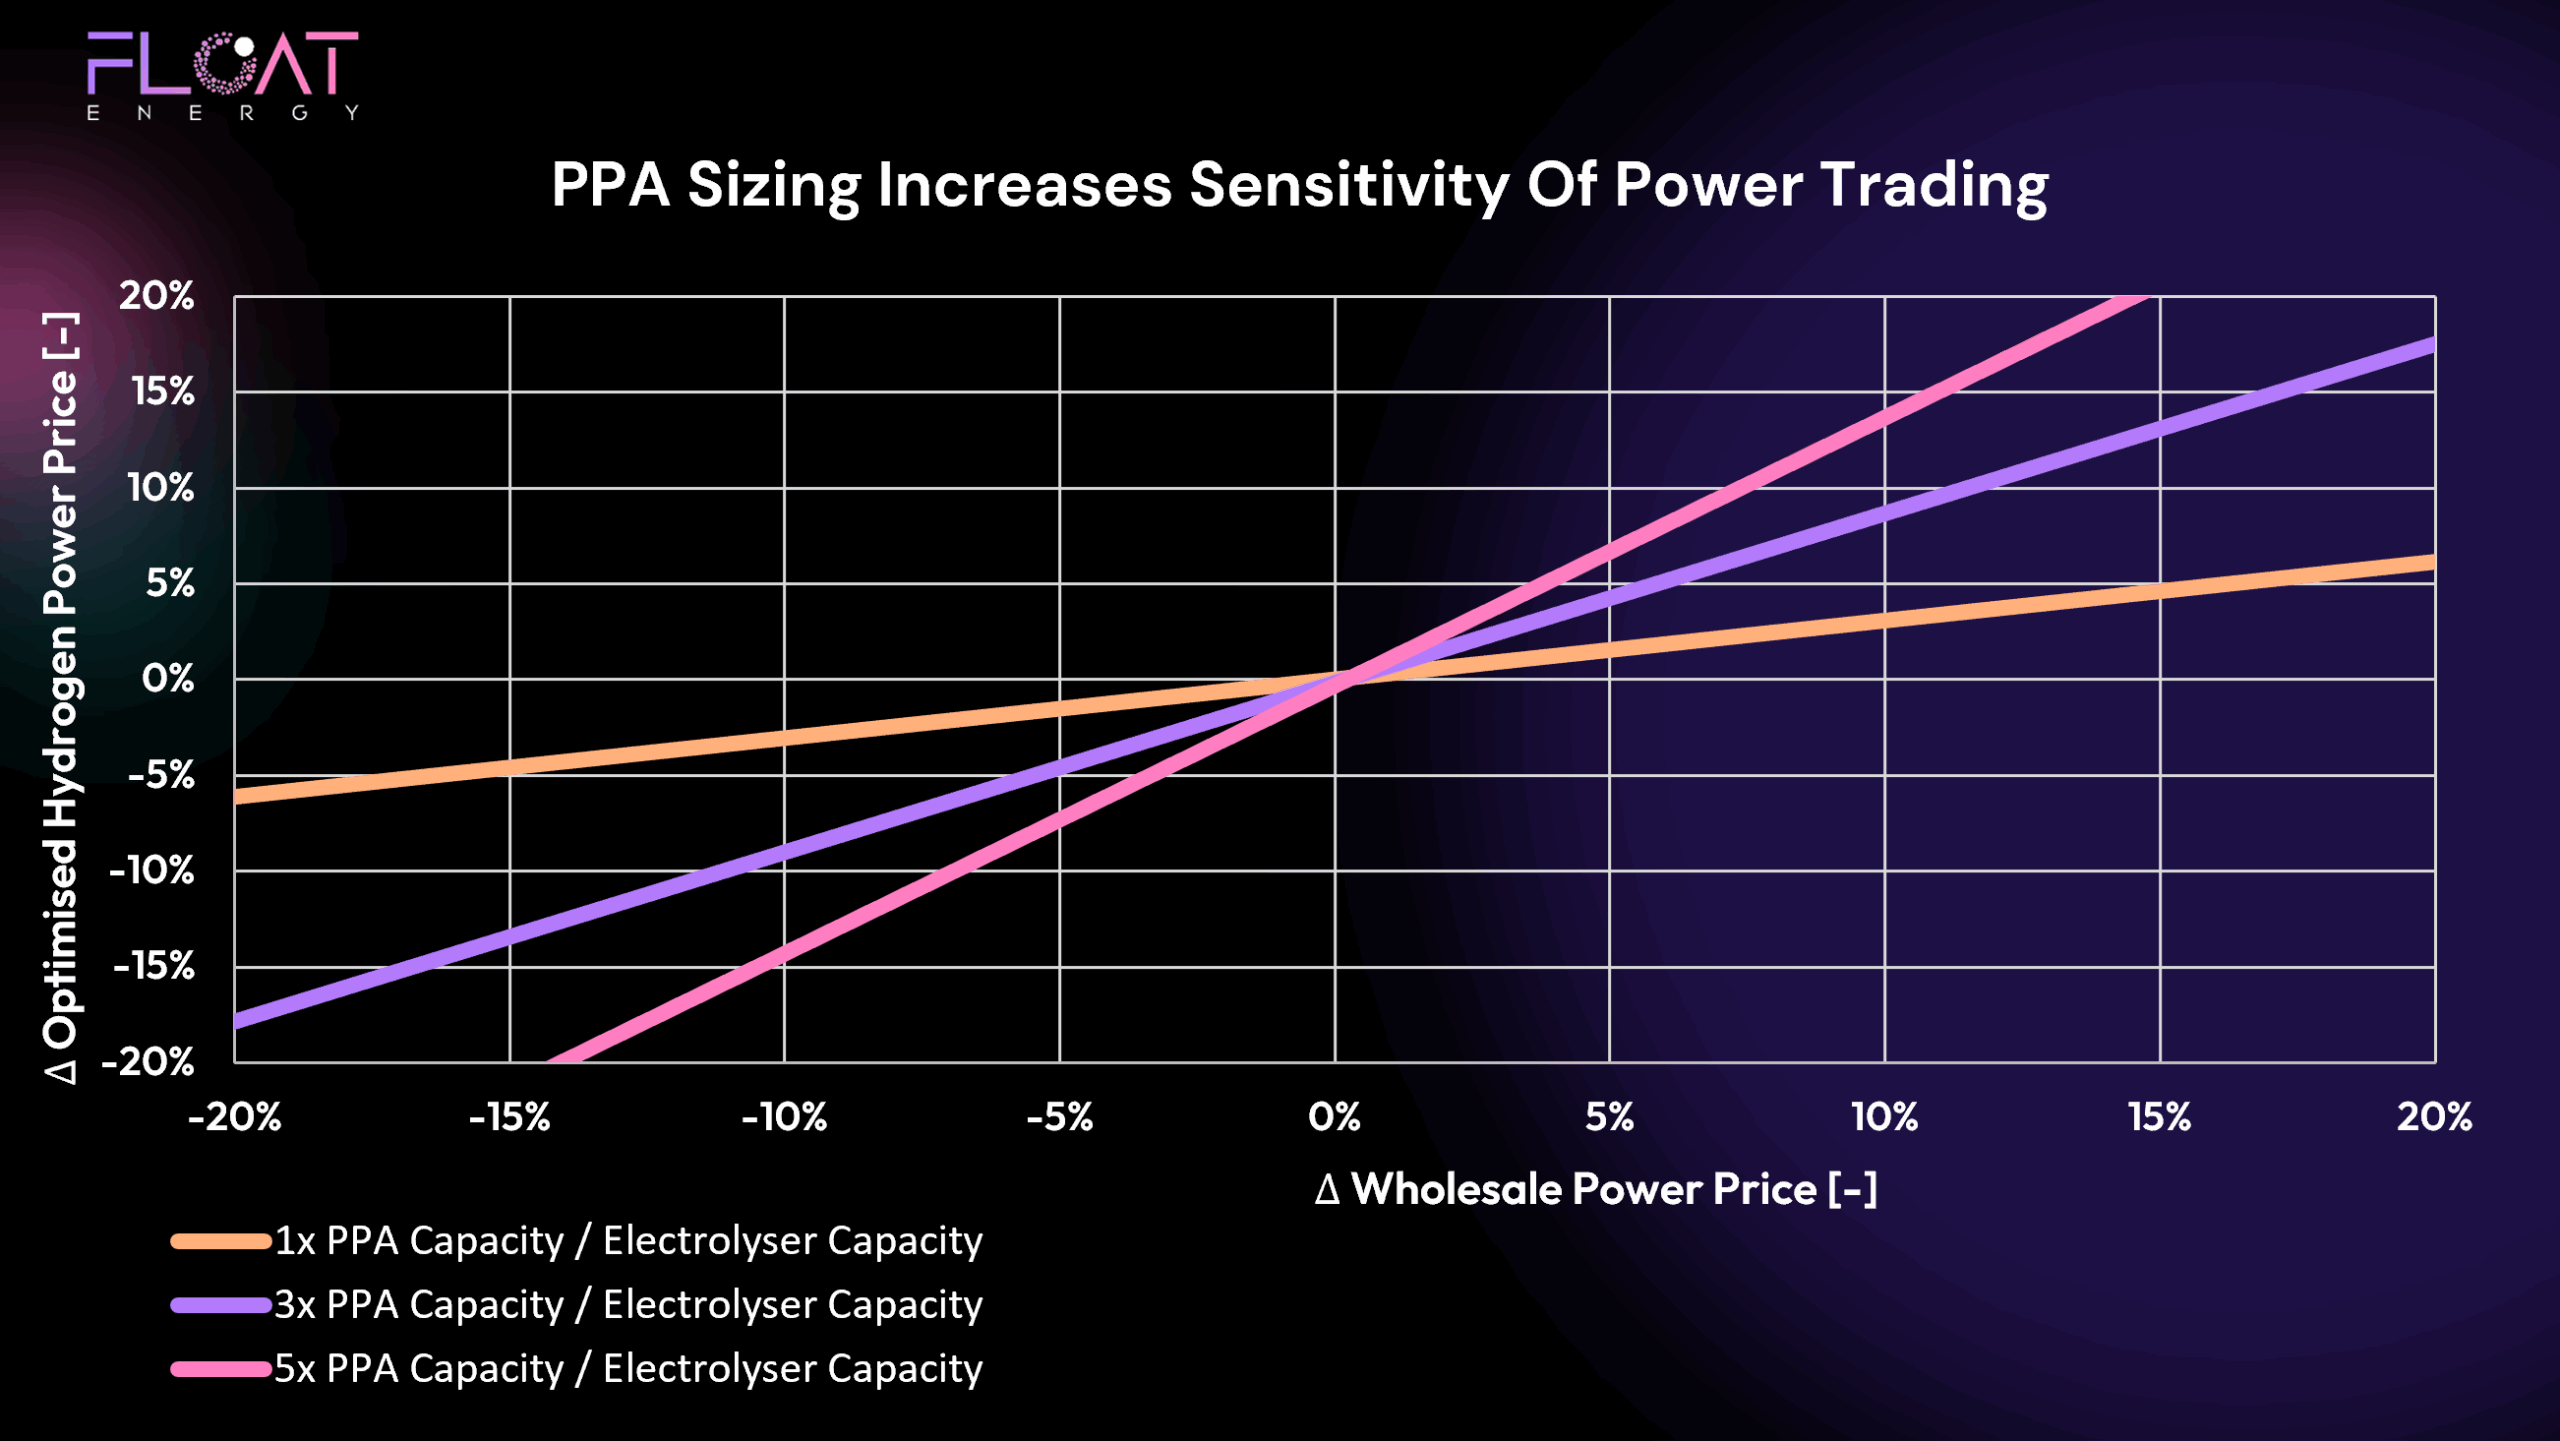
Enabling surplus trading and flexibility during volatile market periods
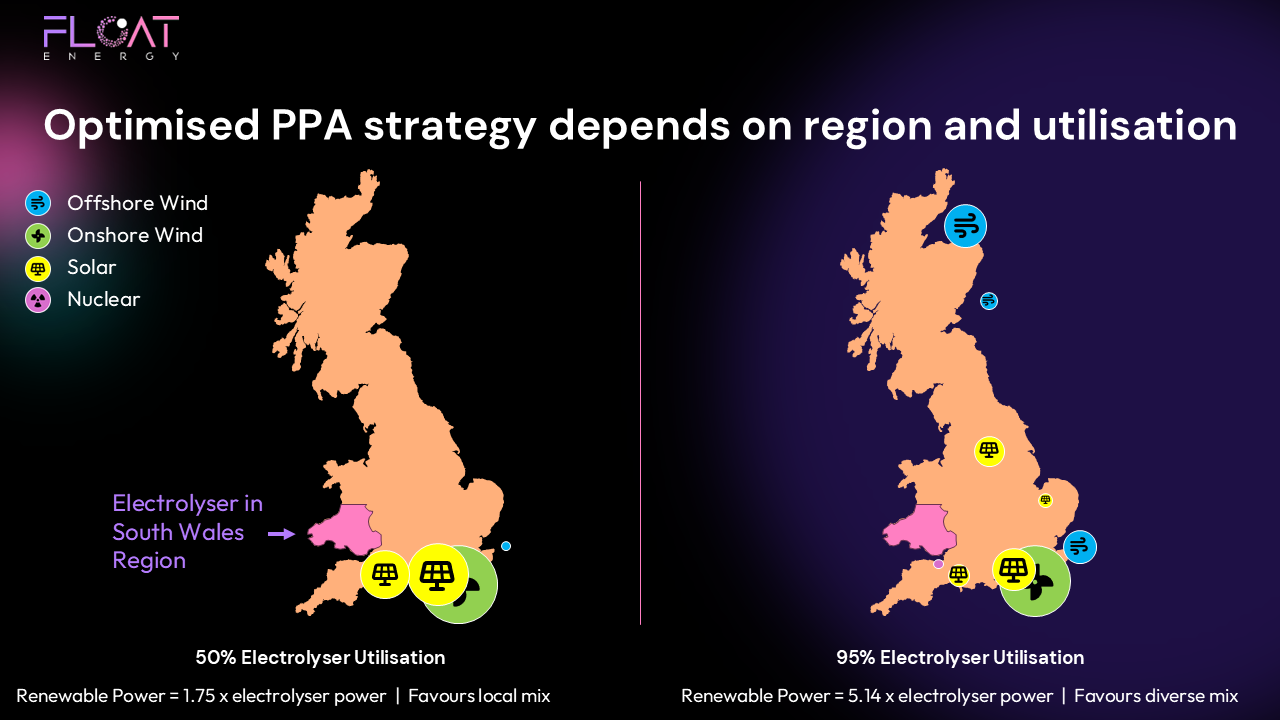
FLOAT supports clients in sizing PPAs appropriately during project development and optimising them during operations through trading strategies alongside grid flexibility.
Key Takeaways from May 2025
✅ Real-time optimisation delivered cost control in varied power prices
✅ Carbon intensity improved thanks to cleaner grid conditions
✅ PPAs remain a key component of long-term resilience
What’s Next?
Looking ahead, June will likely be shaped by:
Ongoing gas price trends
Renewable output stability into summer
Interconnector flows and grid balancing needs
FLOAT will continue tracking these dynamics to ensure hydrogen producers capture the best opportunities while maintaining compliance and resilience.
Ready to Optimise Your Hydrogen Strategy?
FLOAT’s real-time optimiser helps hydrogen producers manage cost, maintain compliance, and capture long-term value through a balanced approach to PPAs and market flexibility.
📩 Contact us to discuss how we can strengthen your hydrogen project’s performance through 2025 and beyond.