
FLOAT Energy Optimiser – Falling Prices, Falling Carbon
Following March’s improvements, April 2025 has brought further good news for hydrogen producers using FLOAT’s real-time optimiser. With wholesale market pressures easing and renewable generation improving, April saw both production costs and carbon intensity fall again — highlighting the continued value of responsive, real-time optimisation.
If you missed last month’s update, you can catch up on our analysis of how FLOAT helped reduce hydrogen costs as markets began to ease in March here. And if you’re interested in understanding how our optimiser is designed to deliver these benefits, you can learn more about it in this blog post.
April Market Context: Why Conditions Improved
April brought much-needed relief to energy markets after a volatile start to the year:
🌿 Renewables Rebound
Higher wind and solar output, typical of spring, helped lower wholesale prices and carbon intensity. This marked a clear shift from the calm, cold conditions that dominated Q1.
🔵 Gas Prices Continued to Ease
European storage levels recovered, and mild temperatures softened demand, helping reduce gas prices. While gas remains the marginal price-setter, its influence on power prices reduced through April.
⚡ Lower Balancing Costs
With more renewables and lower demand, the need for costly balancing actions reduced, helping ease system prices.
FLOAT Optimiser Results – April 2025 Performance
💷 Energy Cost Performance
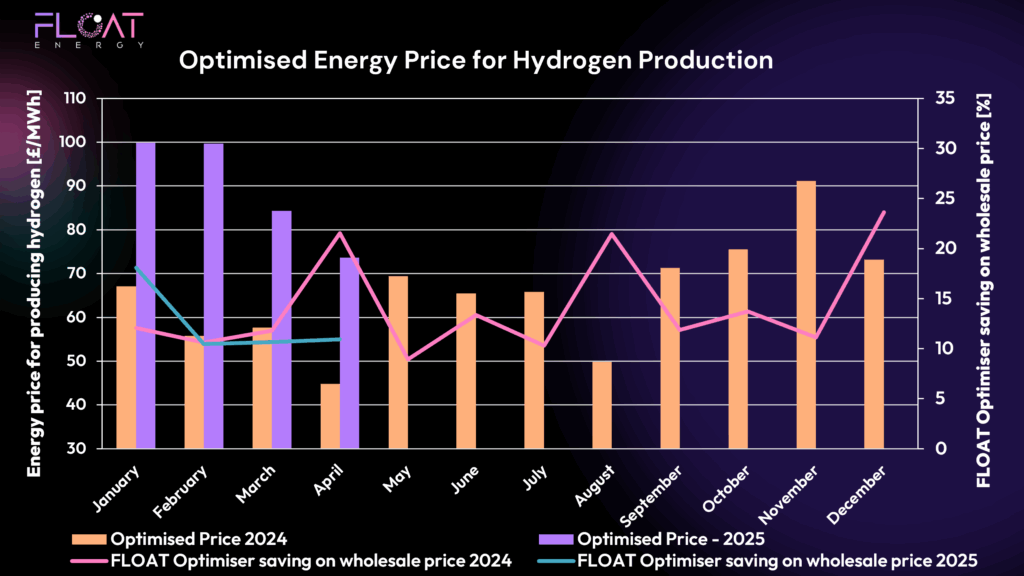
April delivered one of the best results so far in 2025. FLOAT’s optimiser reduced average hydrogen production costs to £74/MWh, thanks to improved market conditions and increased availability of low-cost, renewable electricity.
This demonstrates how real-time optimisation captures market opportunities as soon as they arise — ensuring hydrogen producers benefit from falling costs without delay.
📉 Carbon Intensity Performance
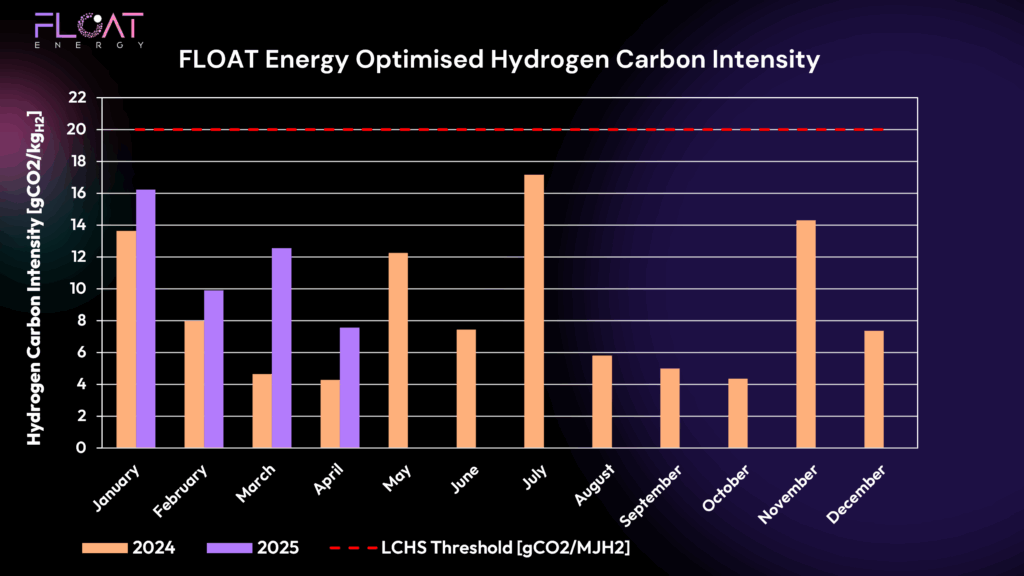
Carbon intensity also fell sharply to 7.5 gCO₂/MJH2 — comfortably within the LCHS threshold of 20 gCO₂/MJH2. Improved renewable output drove this reduction, with FLOAT’s optimiser targeting the cleanest hours for production.
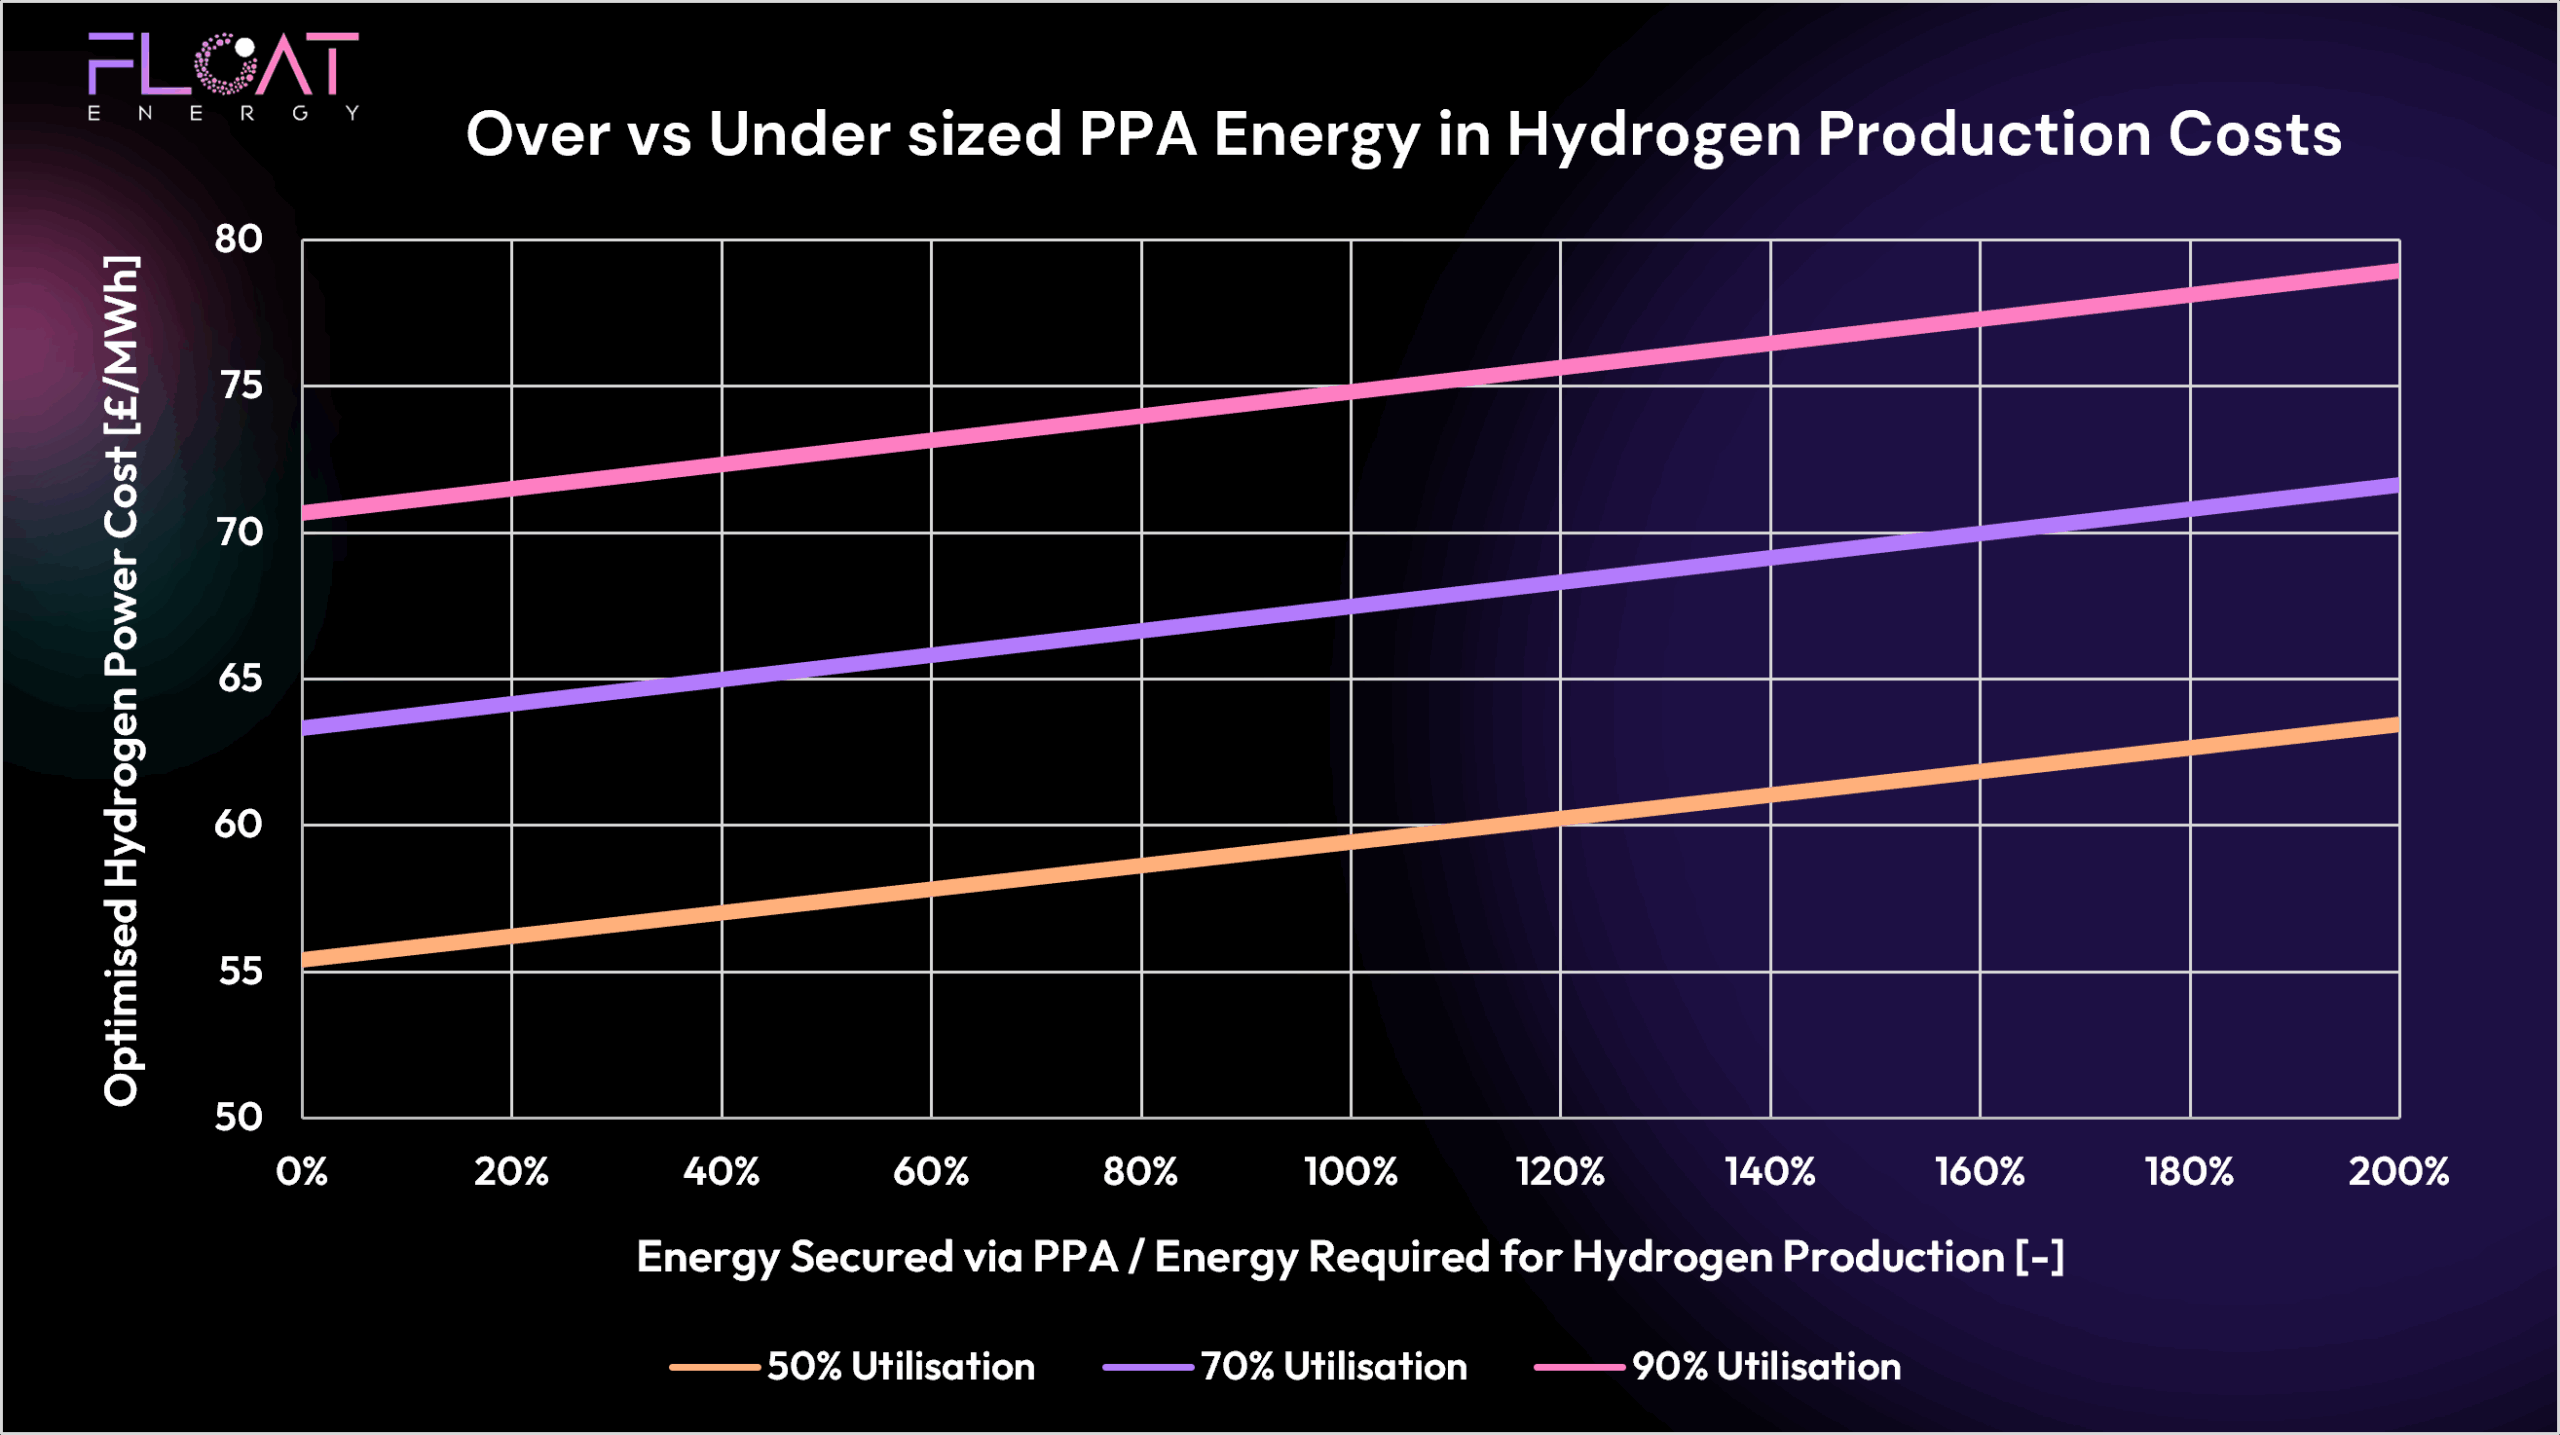
PPAs & Optimisation: A Balanced Strategy
As we’ve highlighted in previous blogs, these results show the benefits of real-time optimisation in a grid-exposed strategy. However, FLOAT recognises the important role that PPAs play:
- Securing long-term price certainty
- Providing bankability for project financing
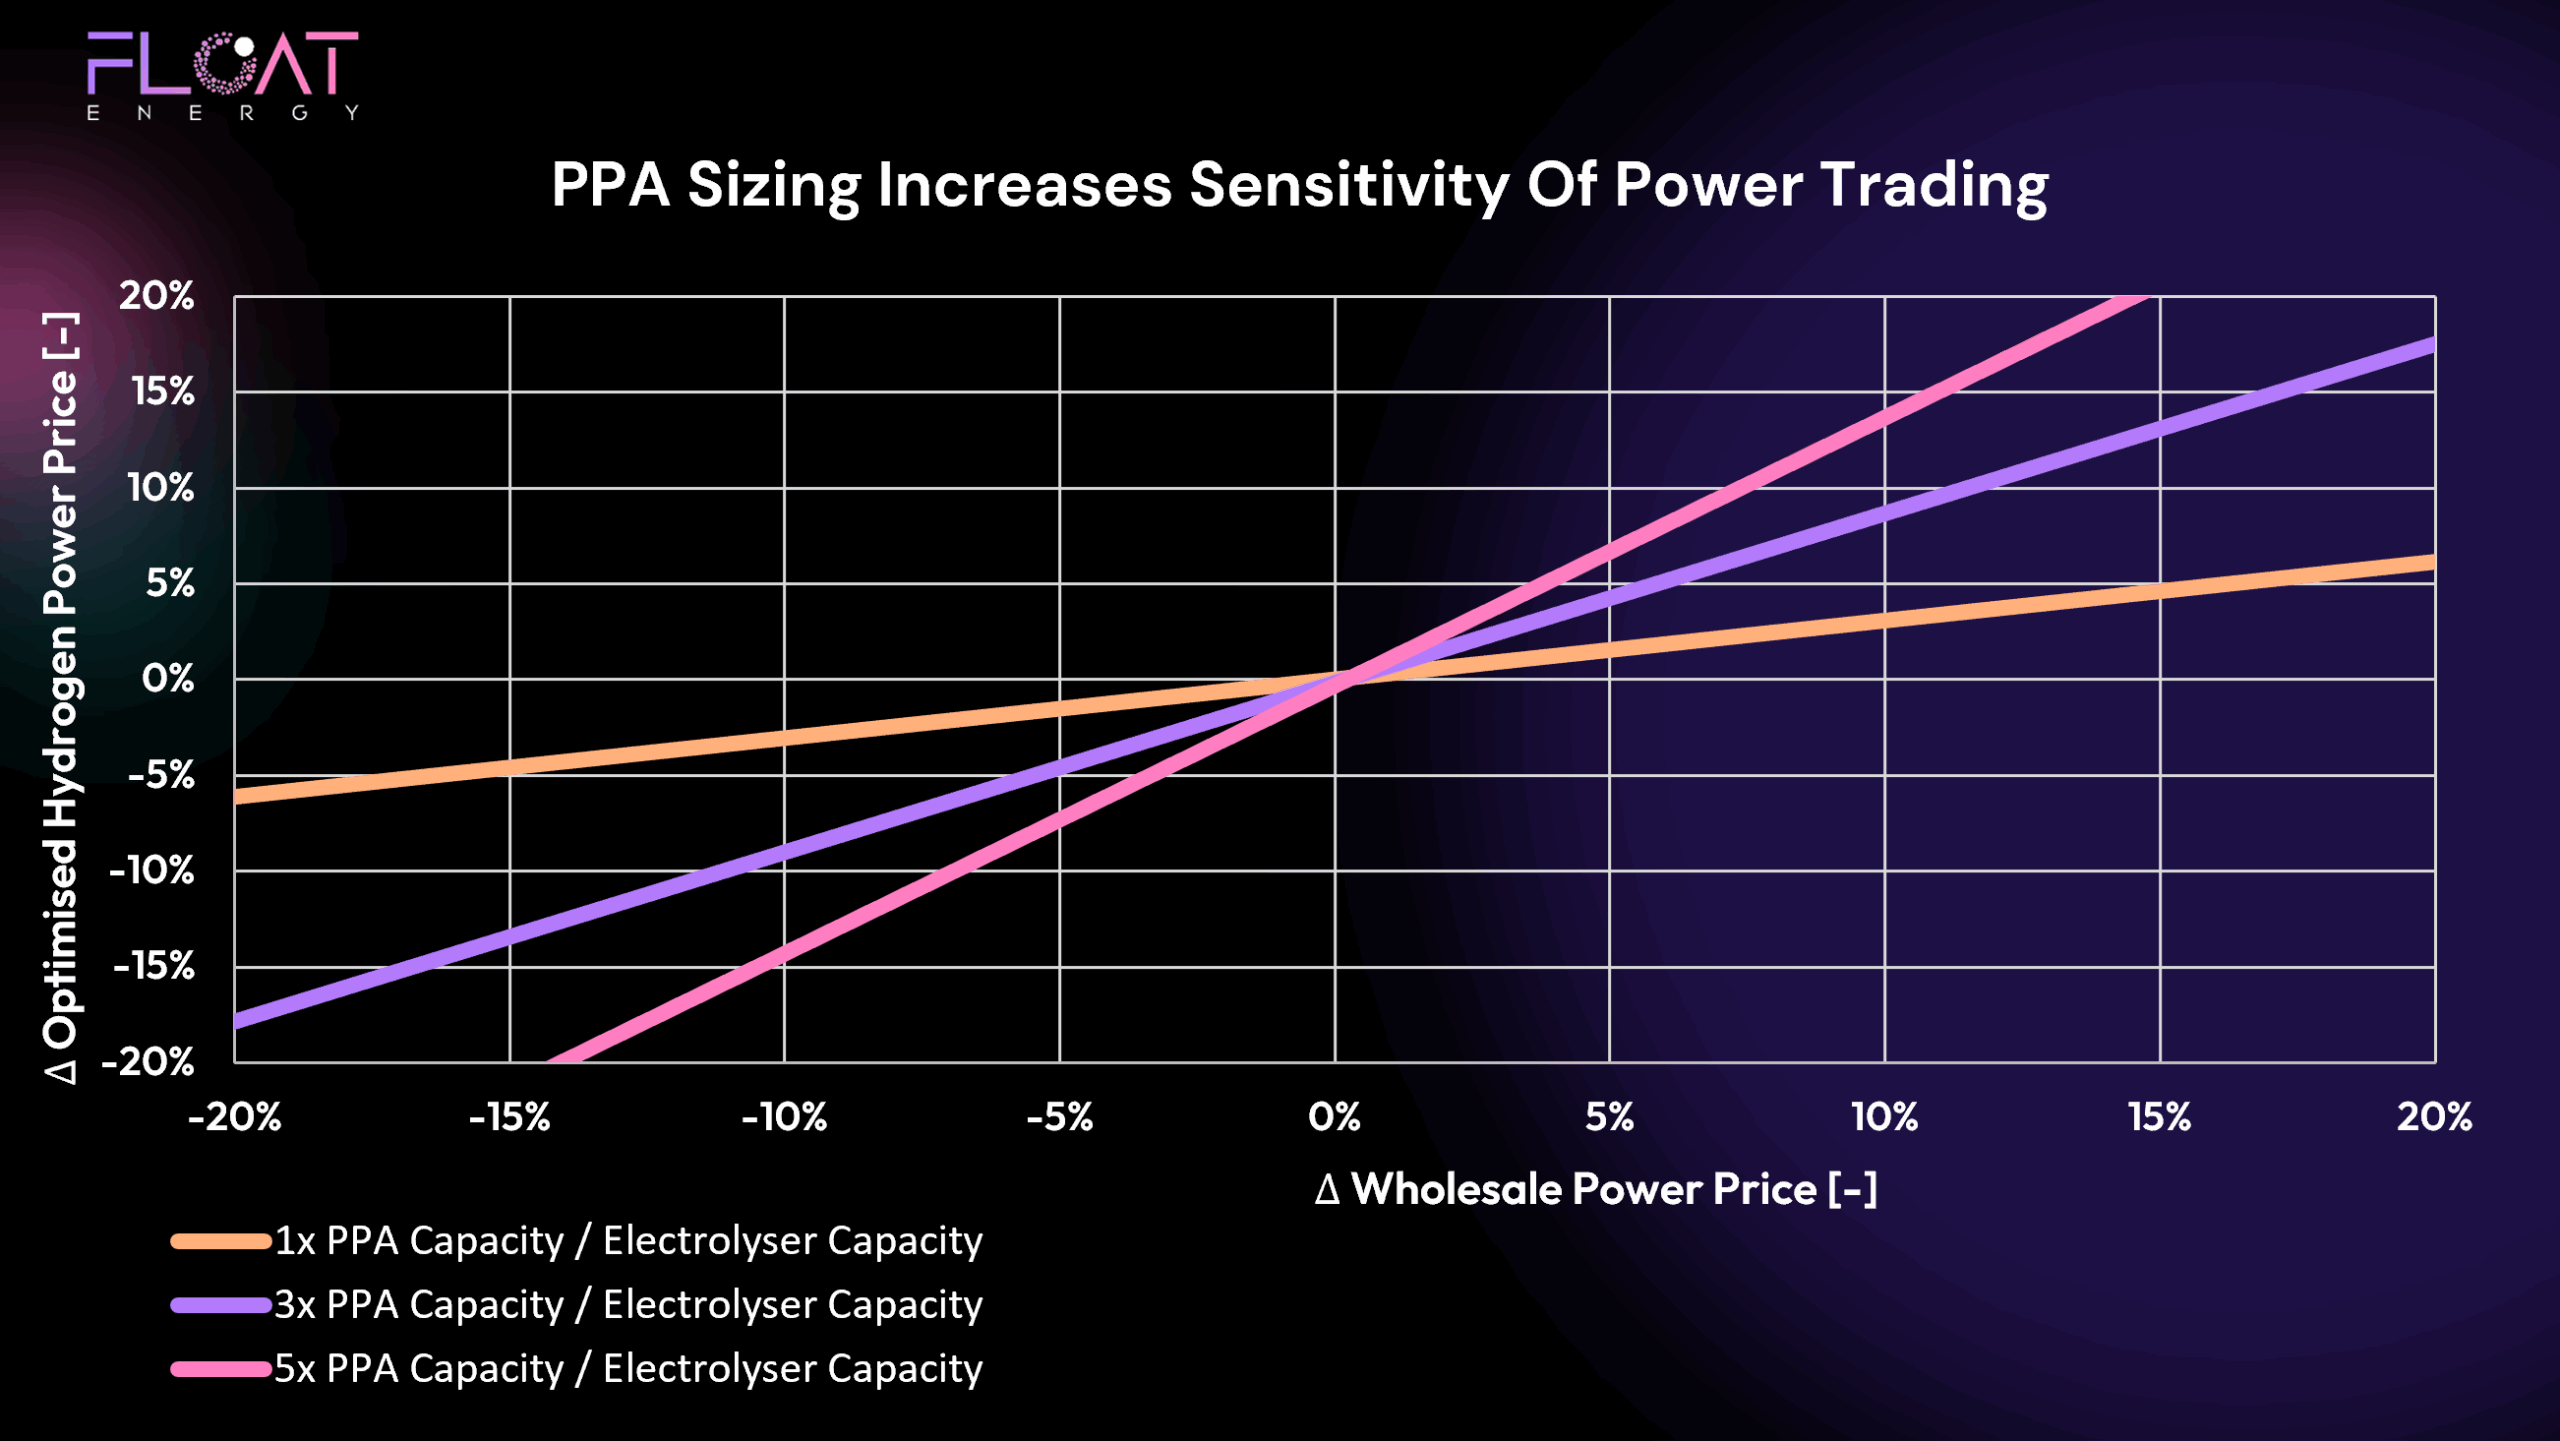
- Offering opportunities to optimise or trade surplus during high-price periods
FLOAT supports both pre-construction sizing of PPAs and operational trading strategies to ensure producers extract maximum value from their procurement structure — whether through PPAs, wholesale, or a blend of both.
Key Takeaways from April 2025
✅ Lowest energy costs so far in 2025
✅ Carbon compliance well within limits
✅ Real-time optimisation captures falling prices and cleaner power
✅ PPAs remain a key part of a balanced, bankable strategy
What’s Next?
With spring progressing and renewables strengthening, we’ll continue tracking how FLOAT’s real-time optimiser helps hydrogen producers capture the benefits of evolving market conditions. Stay tuned for May’s update as we monitor whether this positive trend continues.
Ready to Optimise Your Hydrogen Project?
FLOAT’s real-time optimiser helps you reduce costs, maintain compliance, and integrate flexible procurement strategies that include both PPAs and wholesale opportunities.