
FLOAT Energy Optimiser: Cost Stability, Record Low Carbon Intensity
June 2025 brought a welcome period of stability for hydrogen production costs, following May’s steady performance. While wholesale power prices remained firm, FLOAT’s real-time optimiser maintained competitive production costs and achieved the lowest carbon intensity of the year so far.
If you missed our May update, you can catch up on how FLOAT maintained sub-£65/MWh hydrogen production costs and reduced carbon intensity here.
If you’re interested in how FLOAT’s real-time optimiser is built to deliver these results, you can read more about it in this blog post.
June Market Context: Relief From High Prices
Unlike the expensive conditions seen earlier in 2025, June saw better pricing return to the market, particularly thanks to renewable output
🔵 Wholesale Prices Flatlined
Power prices in June held steady at May’s levels. Key factors included:
- Firm gas markets but no significant further price escalation.
- Renewables performing close to expectations, with solar providing consistent daytime support.
- Interconnectors delivering mixed contributions.
⚡ Balancing Costs Still Present
Balancing actions remained costly during certain hours, but no major system shocks occurred.
FLOAT Optimiser Results – June 2025 Performance
💷 Energy Cost Performance
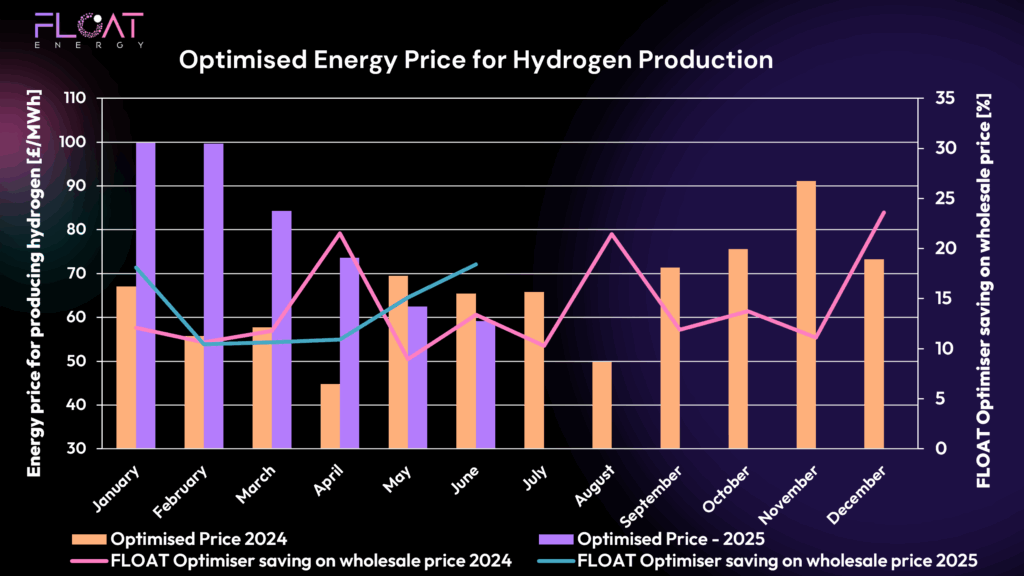
FLOAT’s real-time optimiser maintained an average hydrogen production cost of just under £65/MWh for June, holding steady with May.
However, the optimiser’s percentage saving relative to wholesale prices improved, as clearer low-cost operating windows emerged. This improvement is reflected in the blue line on your performance graph.
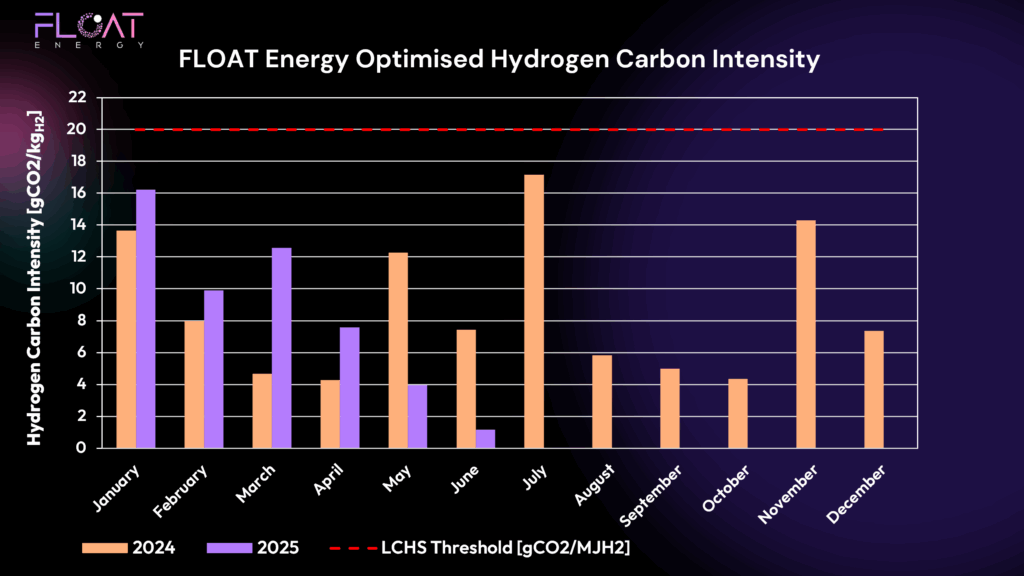
📉 Carbon Intensity Performance
June delivered a record low carbon intensity of just 1 gCO₂/MJH2 for 2025.
This reflects:
- Increased solar output providing cleaner grid windows.
- FLOAT’s optimiser effectively targeting the cleanest hours.
Hydrogen production remained well within the UK LCHS threshold of 20 gCO₂/MJH₂.
PPAs, Trading & Real-Time Optimisation
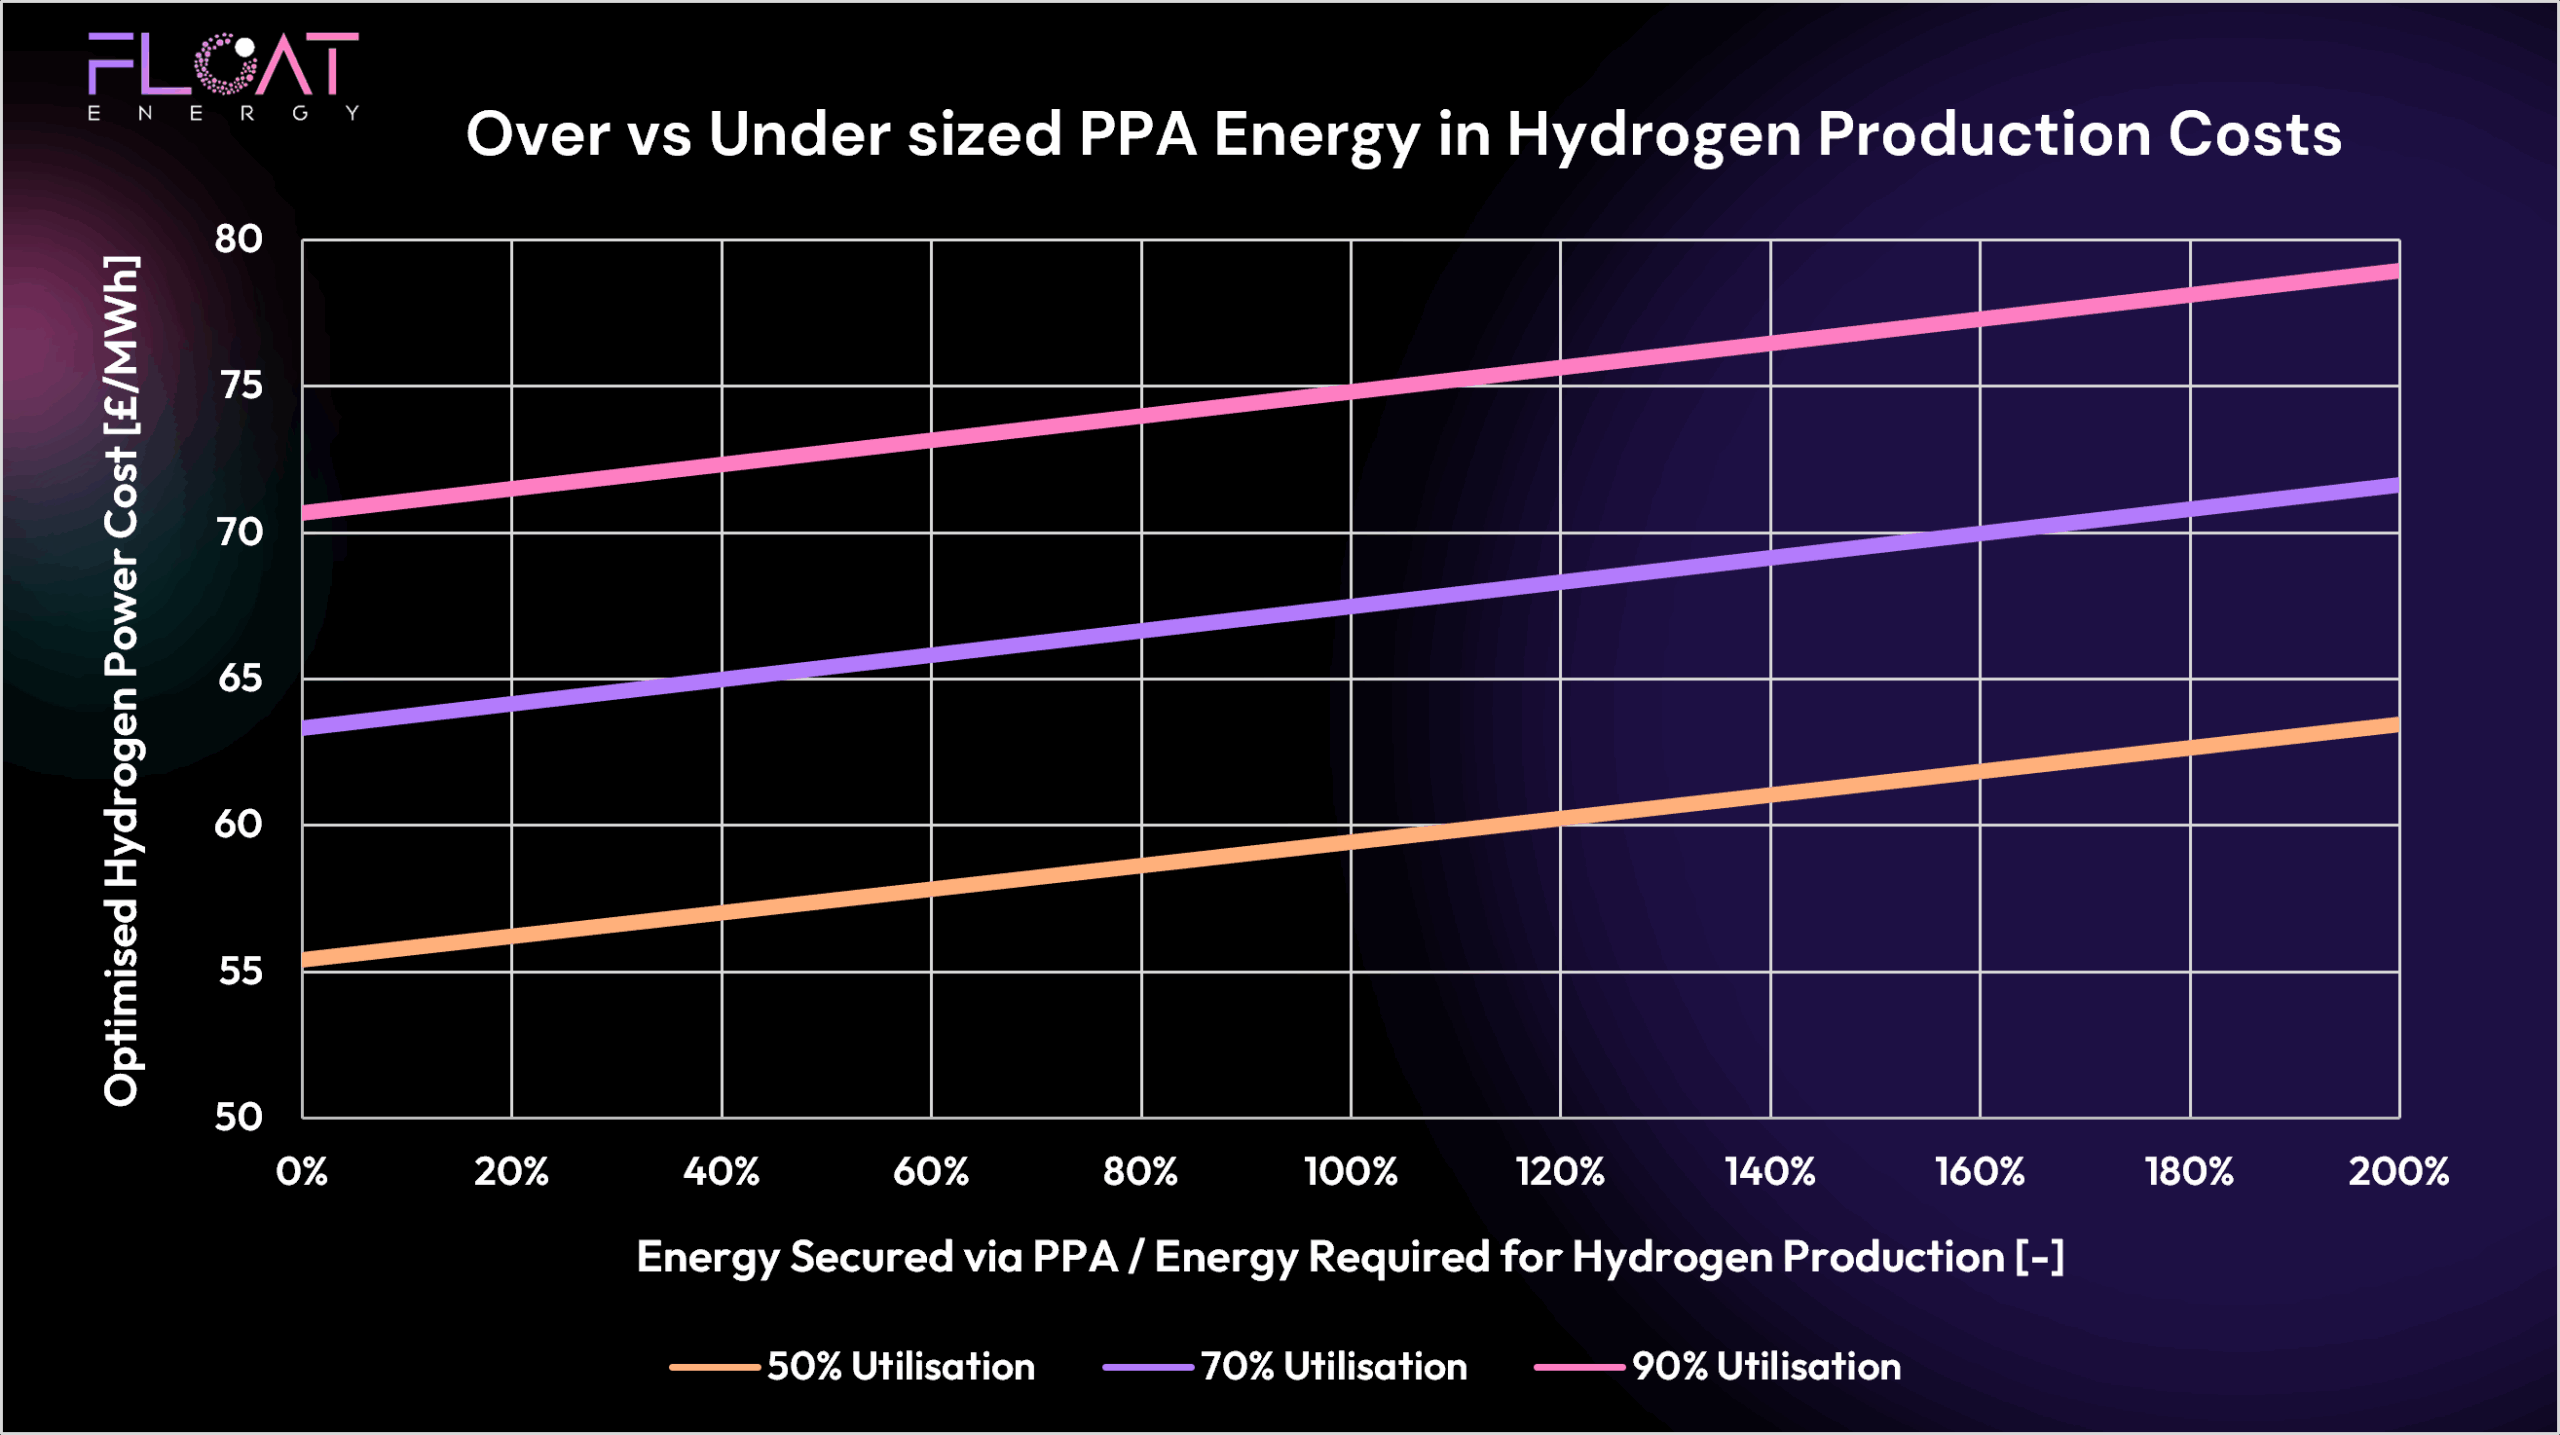
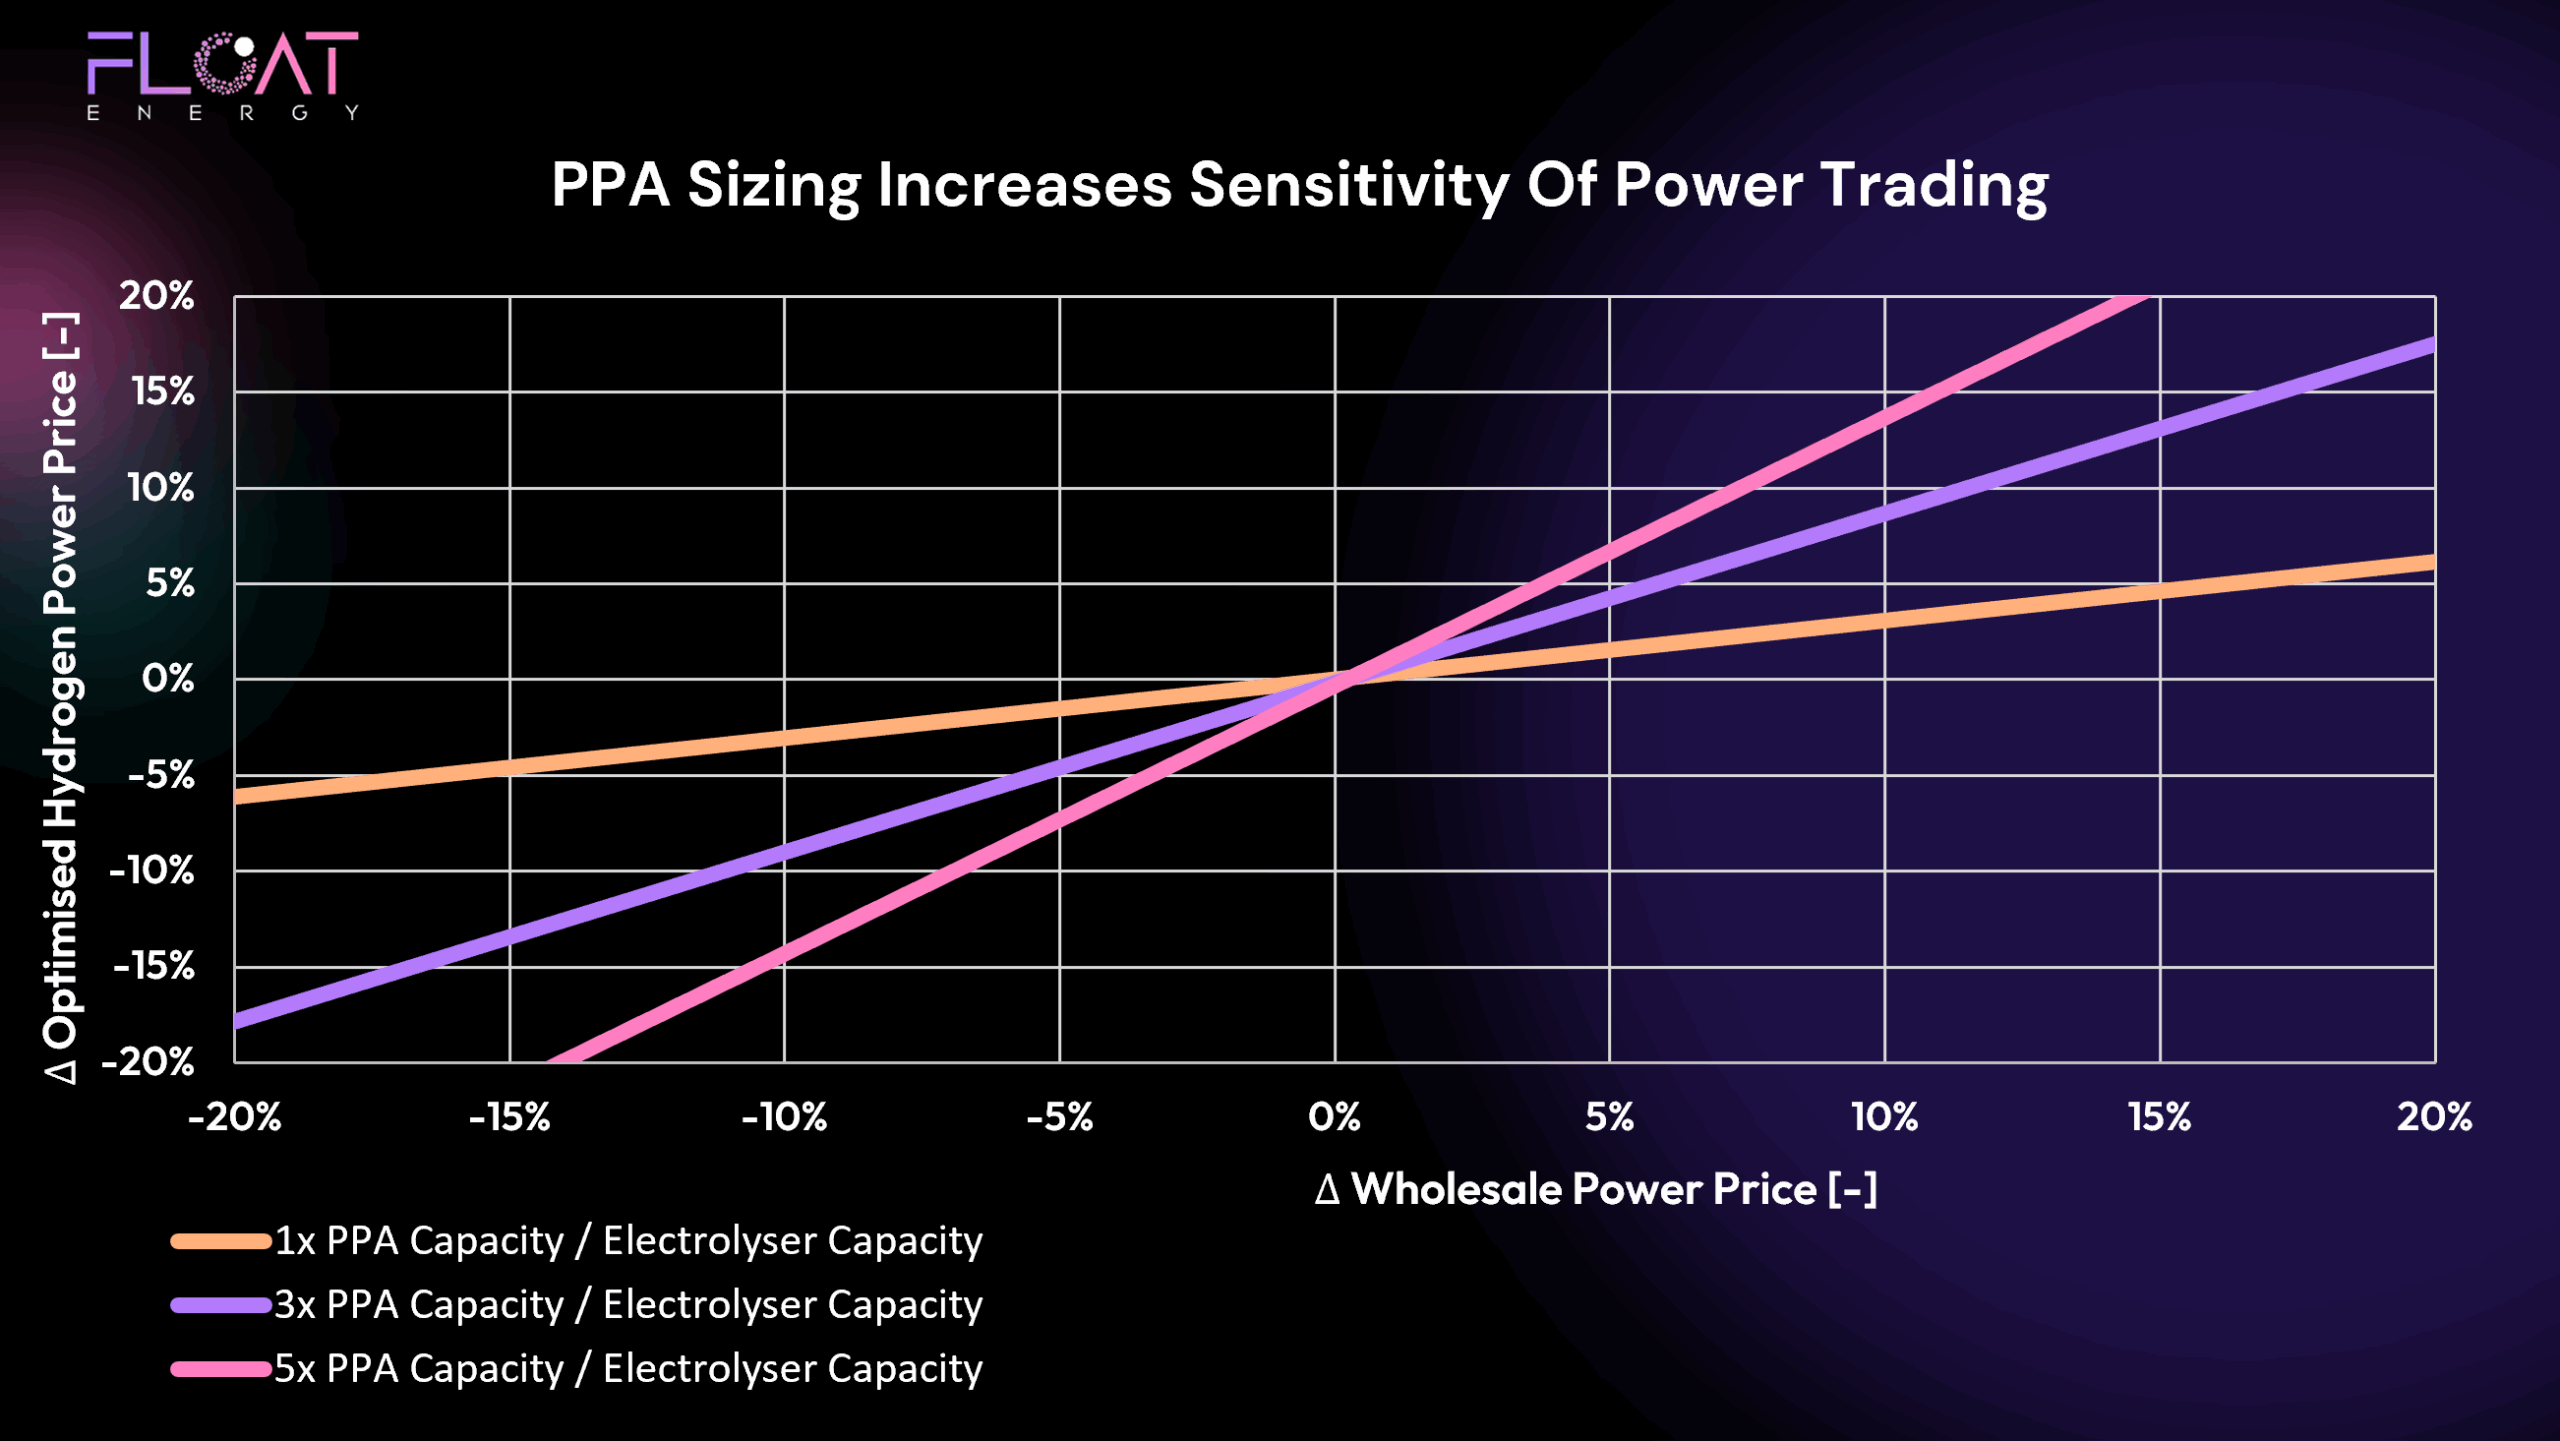
While this month’s performance reflects grid-exposed optimisation, PPAs remain an important strategic tool for hydrogen producers:
- Securing long-term price certainty and bankability.
- Providing compliance confidence through dedicated renewable supply.
- Enabling flexibility to optimise or trade surplus during market volatility.
FLOAT supports both PPA sizing during development and real-time operational strategies to extract full value alongside grid optimisation.
Key Takeaways from June 2025
✅ Hydrogen production costs held steady at competitive levels
✅ Optimiser performance improved through better savings
✅ Carbon intensity reached the lowest point of the year
✅ PPAs remain a key element alongside flexible grid access
What’s Next?
Looking ahead to July, market attention will remain on:
- Gas market movements and storage injections.
- Renewables performance, particularly wind.
- Interconnector stability through the summer months.
FLOAT will continue adjusting strategies to protect hydrogen producers and capture the best available opportunities.
Ready to Optimise Your Hydrogen Strategy?
FLOAT’s real-time optimiser helps hydrogen producers reduce costs, maintain compliance, and strengthen long-term project value through an integrated approach to PPAs and wholesale flexibility.