
Market Pressures Continue to Shape Hydrogen Costs
In January’s blog, we highlighted how extreme weather, tight gas markets, and constrained interconnector flows drove UK electricity prices sharply higher, impacting hydrogen production costs across the market. February continued many of those same trends, but with new dynamics reinforcing the need for flexibility and market responsiveness.
For hydrogen producers looking to manage energy risks and remain competitive, FLOAT’s optimiser continues to show its value — protecting against volatility while maintaining carbon compliance.
February 2025 Market Context: Why Prices Remained High
Understanding February’s results means first understanding the market. Several key factors continued to shape wholesale power prices throughout the month:
Gas Prices Remained Elevated
The supply issues from January, particularly around overseas gas outages, lingered well into February. These constraints limited flexibility in the European gas market and kept UK gas prices high.
With gas still setting the marginal price in the UK merit order, elevated gas prices continued to drive electricity prices upwards — even during periods of moderate demand.
Cold Weather Increased System Tightness
The UK experienced a second, more prolonged cold snap in February, boosting demand for heating and electricity. This pushed up day-ahead prices.
Interconnectors Remained Unpredictable
While interconnectors did help alleviate some of January’s tightness, February saw continued volatility in flows. The UK shifted between exporting surplus wind generation and importing expensive power during low-output periods. This flip-flopping contributed to sharp price swings and left the market exposed during wind lulls.
Balancing Costs Increased Again
With system stress continuing, the Balancing Mechanism (BM) saw increased use of flexible gas and peaker plants at premium rates to keep the lights on. This pushed marginal costs even higher during critical periods.
Capacity Market Signals Tight Years Ahead
February’s Capacity Market auctions cleared at higher prices than in recent years, signalling the market’s recognition of structural tightness. This influences forward curves and reinforces the long-term premium on flexibility.
February 2025 FLOAT Optimiser Results
💷 Energy Price Performance
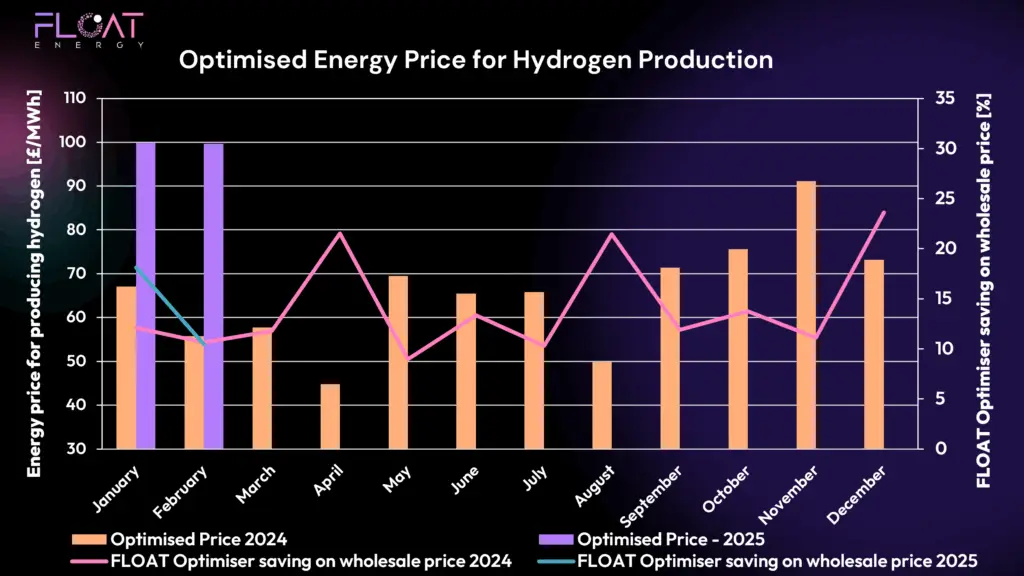
In line with market conditions, FLOAT’s optimiser delivered an average £100/MWh production price for February hydrogen — matching January’s result. This consistency highlights the optimiser’s ability to protect producers from volatility, even as wholesale prices remained under sustained upward pressure.
While the optimiser cannot eliminate exposure to broader market trends, it ensures hydrogen production remains strategically scheduled to minimise cost and avoid the most expensive hours.
Notably, this month’s results demonstrate that the optimiser’s role is evolving from simply chasing the cheapest prices to actively managing exposure during market stress — a key capability for producers seeking resilience.
🌍 Carbon Intensity Performance
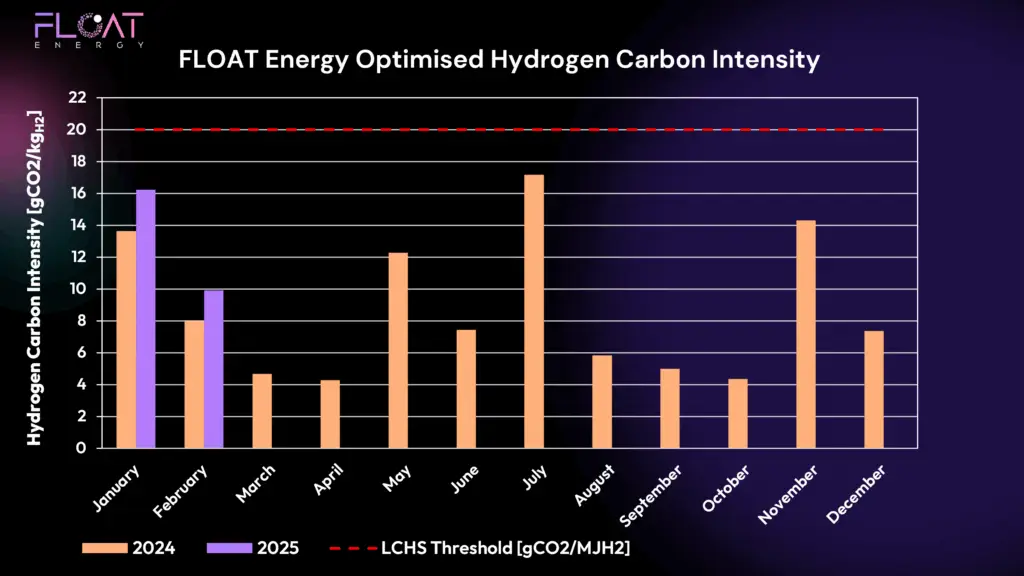
Carbon intensity improved from January, falling to 10 gCO₂/MJH2 as renewable output slightly recovered later in the month. This remains comfortably within the LCHS 20 gCO₂/MJH2 threshold.
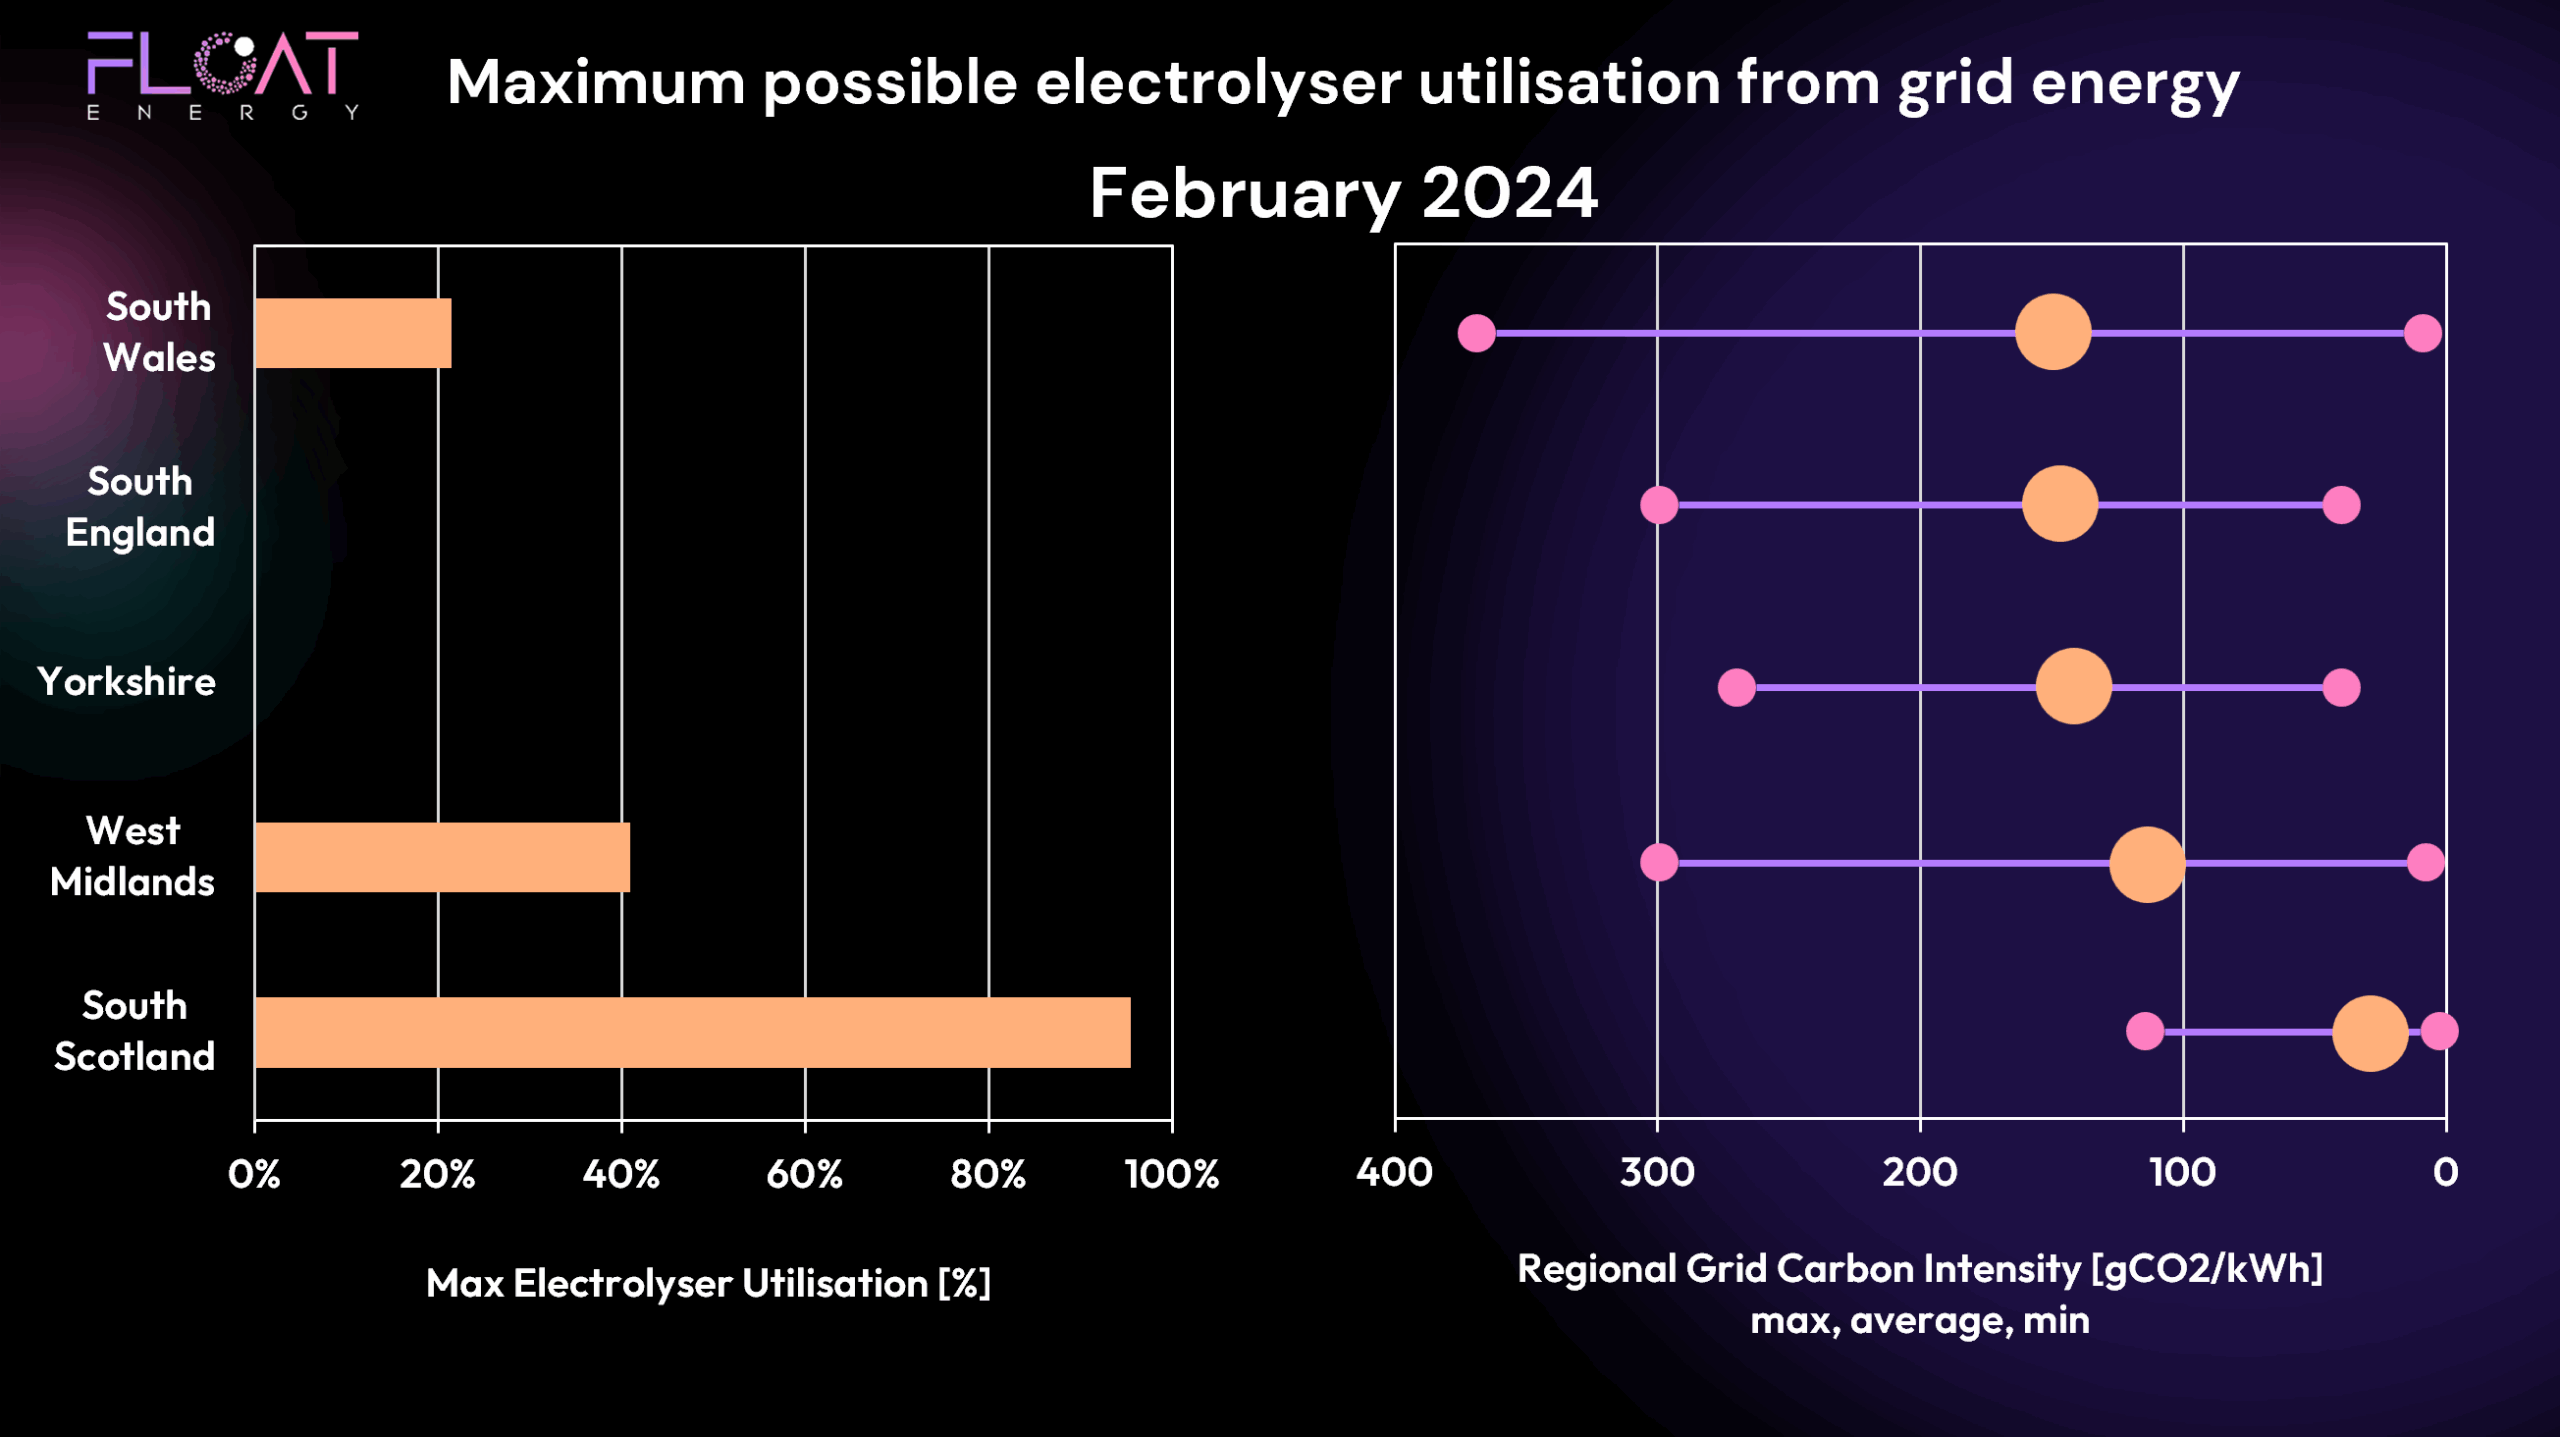
Once again, achieving carbon compliance depends on production schedule and regional grid CO2. In this case we are looking at Scotland which has a very high proportion of renewables and optimum electrolyser dispatch mostly coincided with low cost energy. As a result, the UK LCHS limit didn’t come into play. In other regions and months this isn’t the case!
Why This Matters for Hydrogen Producers
February confirms what January signposted:
- Market volatility is structural, not temporary.
- Gas remains the price setter, even when renewables increase their share.
- Interconnector flows cannot be relied on for stability.
- Balancing costs will remain high in a stressed system which puts a premium on flexibility
FLOAT’s optimiser protects hydrogen producers by navigating these pressures — dynamically adapting to minimise costs while maintaining compliance.
Key Lessons from February 2025
✅ Optimisation shields producers from the worst market impacts
✅ Carbon compliance remains achievable without PPAs (although these are important for other reasons)
✅ Flexibility in power procurement and operations is now critical for resilience
Looking Ahead to March:
As we head into spring, the market’s focus will shift to renewable output, interconnector performance, and the forward gas market outlook. We’ll report next month on how FLOAT continues to adapt and deliver competitive, compliant hydrogen production through these evolving conditions.
Ready to Strengthen Your Energy Strategy?
If you want to secure competitive hydrogen production costs despite market volatility, FLOAT’s optimiser is here to help.