
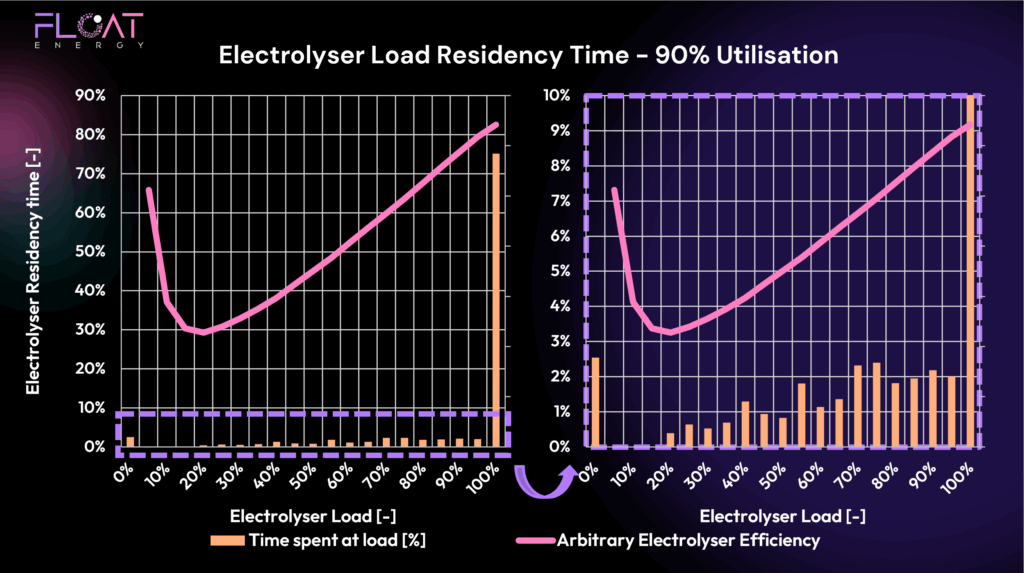
At 90% utilisation:
- The system spends most of its time at 100% load
- Sub-optimal efficiency, but required to meet volume targets
Why Run at Full Load if It’s Less Efficient?
Because electricity price variability — not efficiency — is the dominant driver.
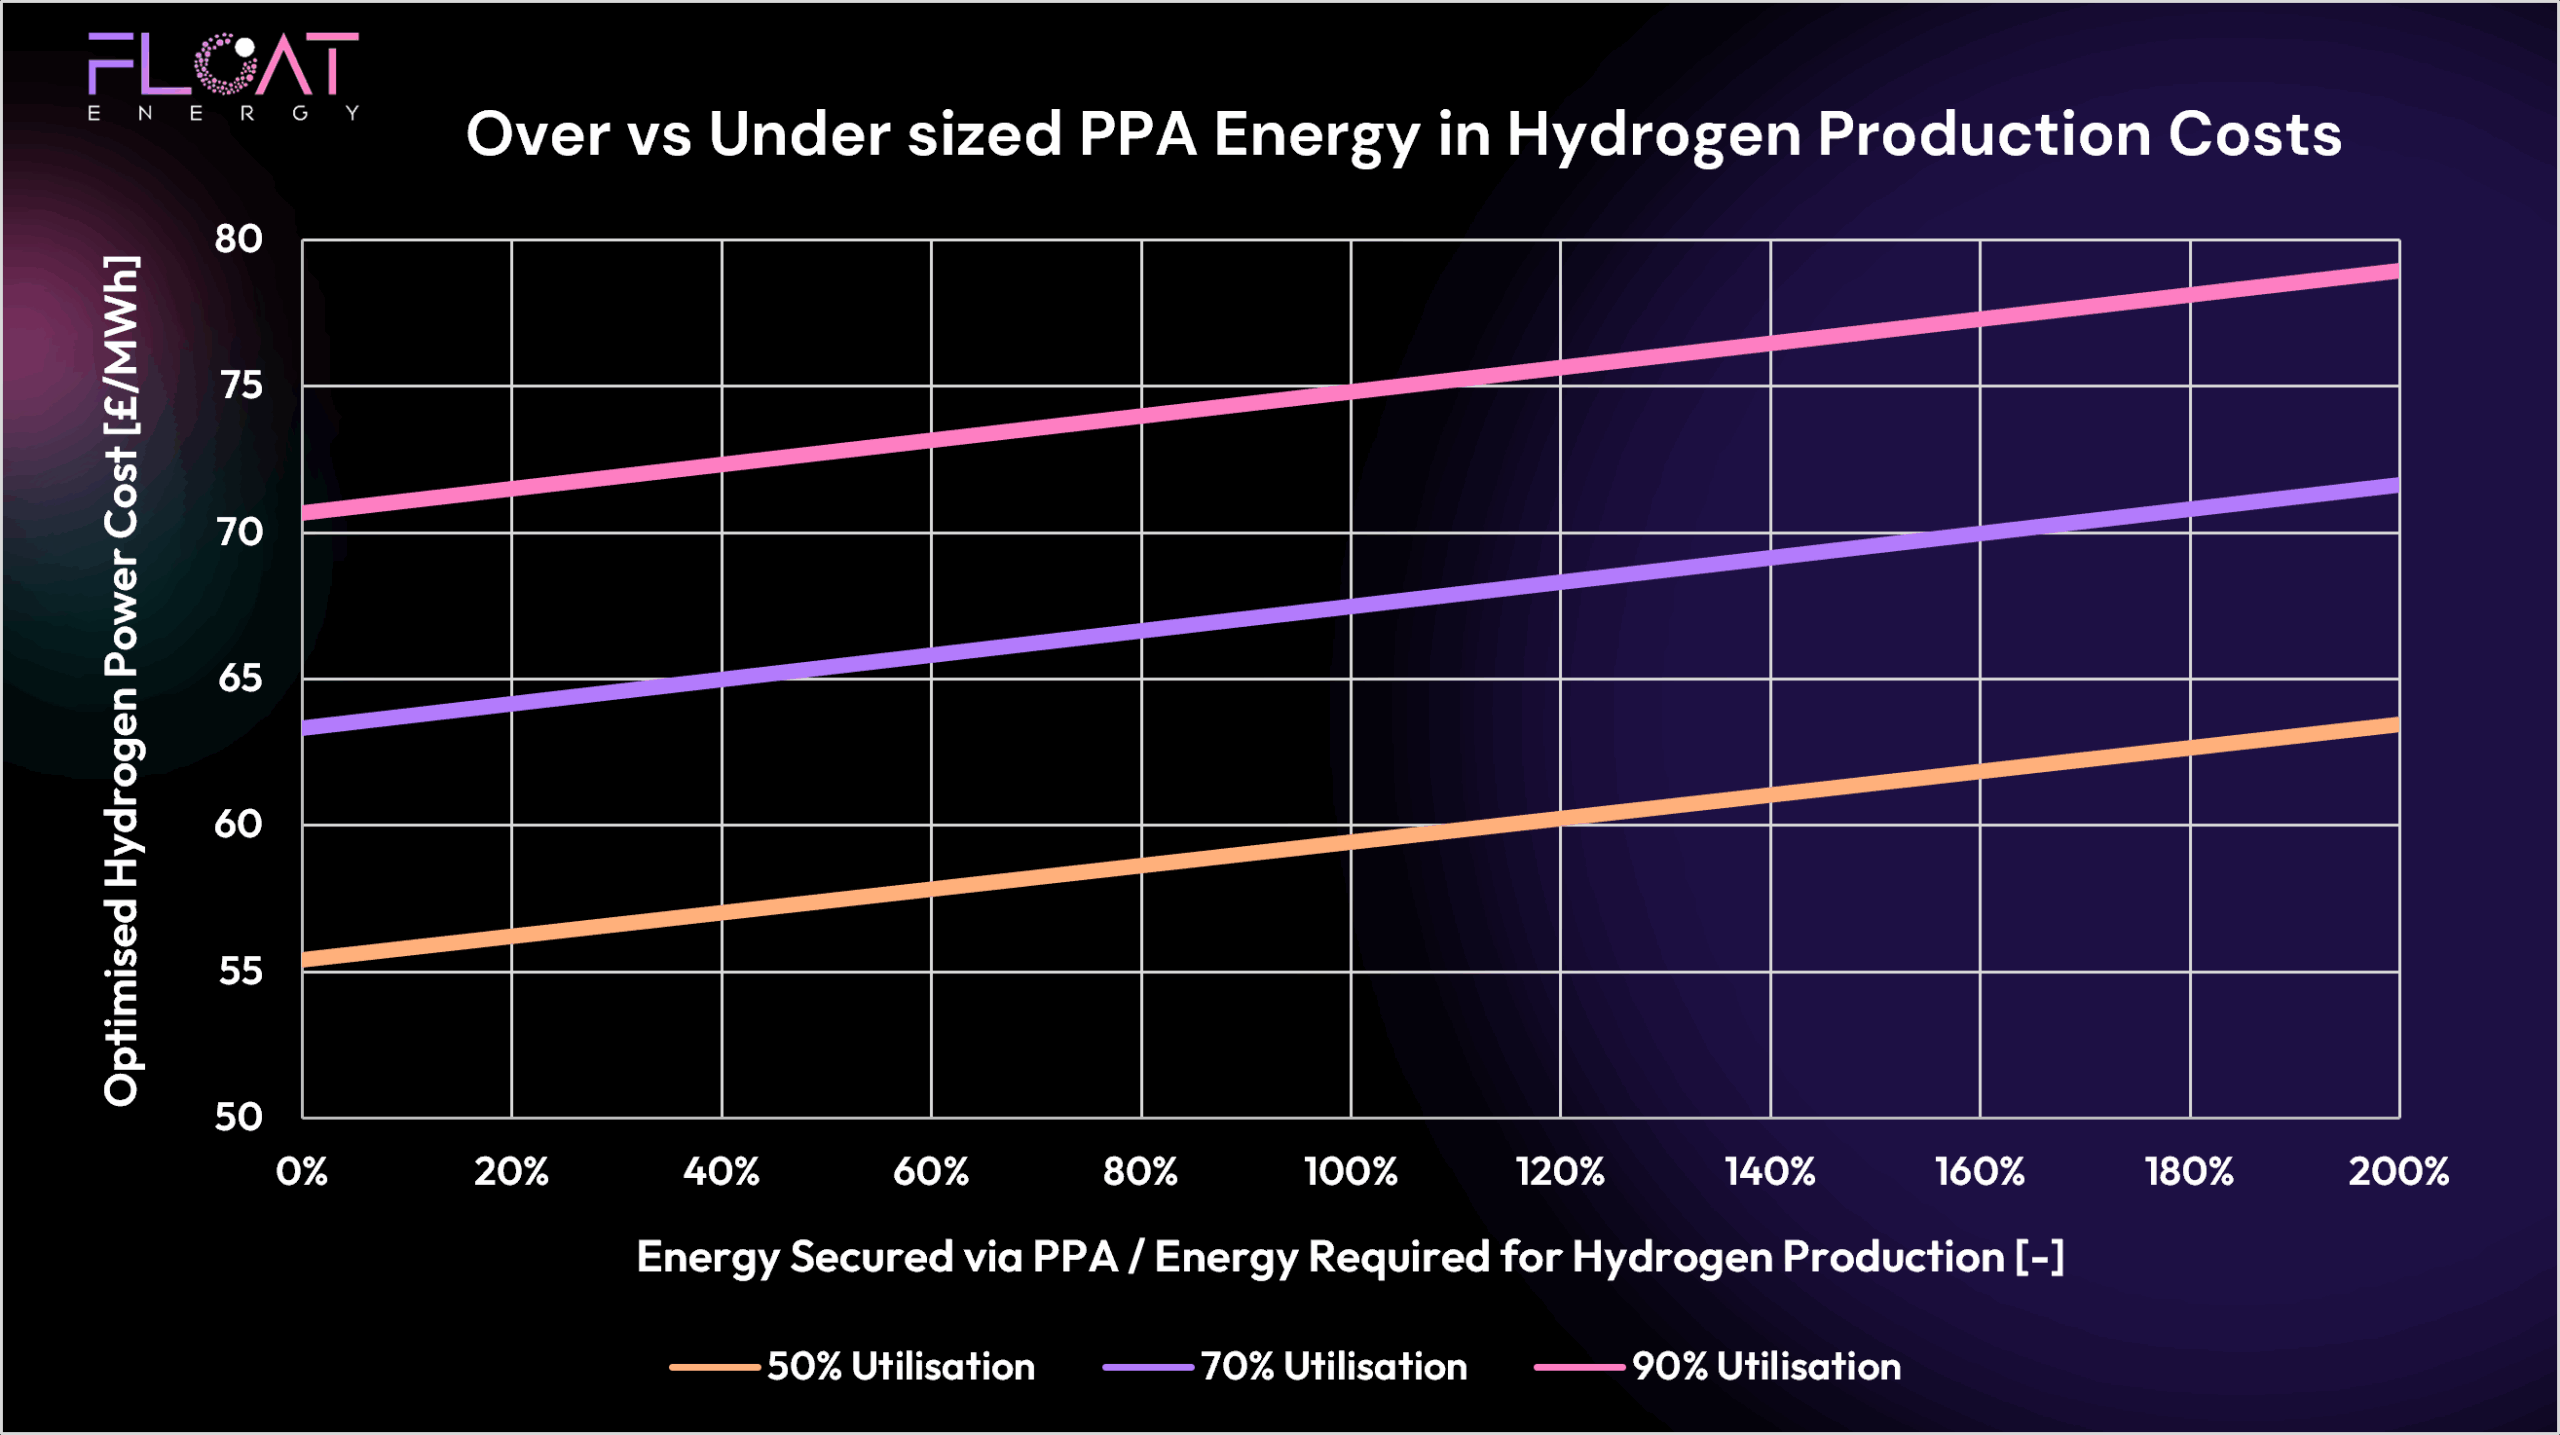
If you can buy power at £30/MWh:
- Running at 50 kWh/kg (part load) → £1.50/kg hydrogen
- Running at 55 kWh/kg (full load) → £1.65/kg hydrogen
Sure, full load is 10% less efficient — but in a few hours, that price might have swung up to £120/MWh. If that’s true then it’s worth suffering the efficiency loss in the electrolyser to avoid the x4 higher power cost forecast in the future. Especially if:
- You need to hit offtake commitments
- Hydrogen storage is limited
- A price spike is coming, and you want to stock up
That’s why our optimiser frequently chooses full load during low-price windows.
Why You Still Can’t Ignore the Efficiency Curve
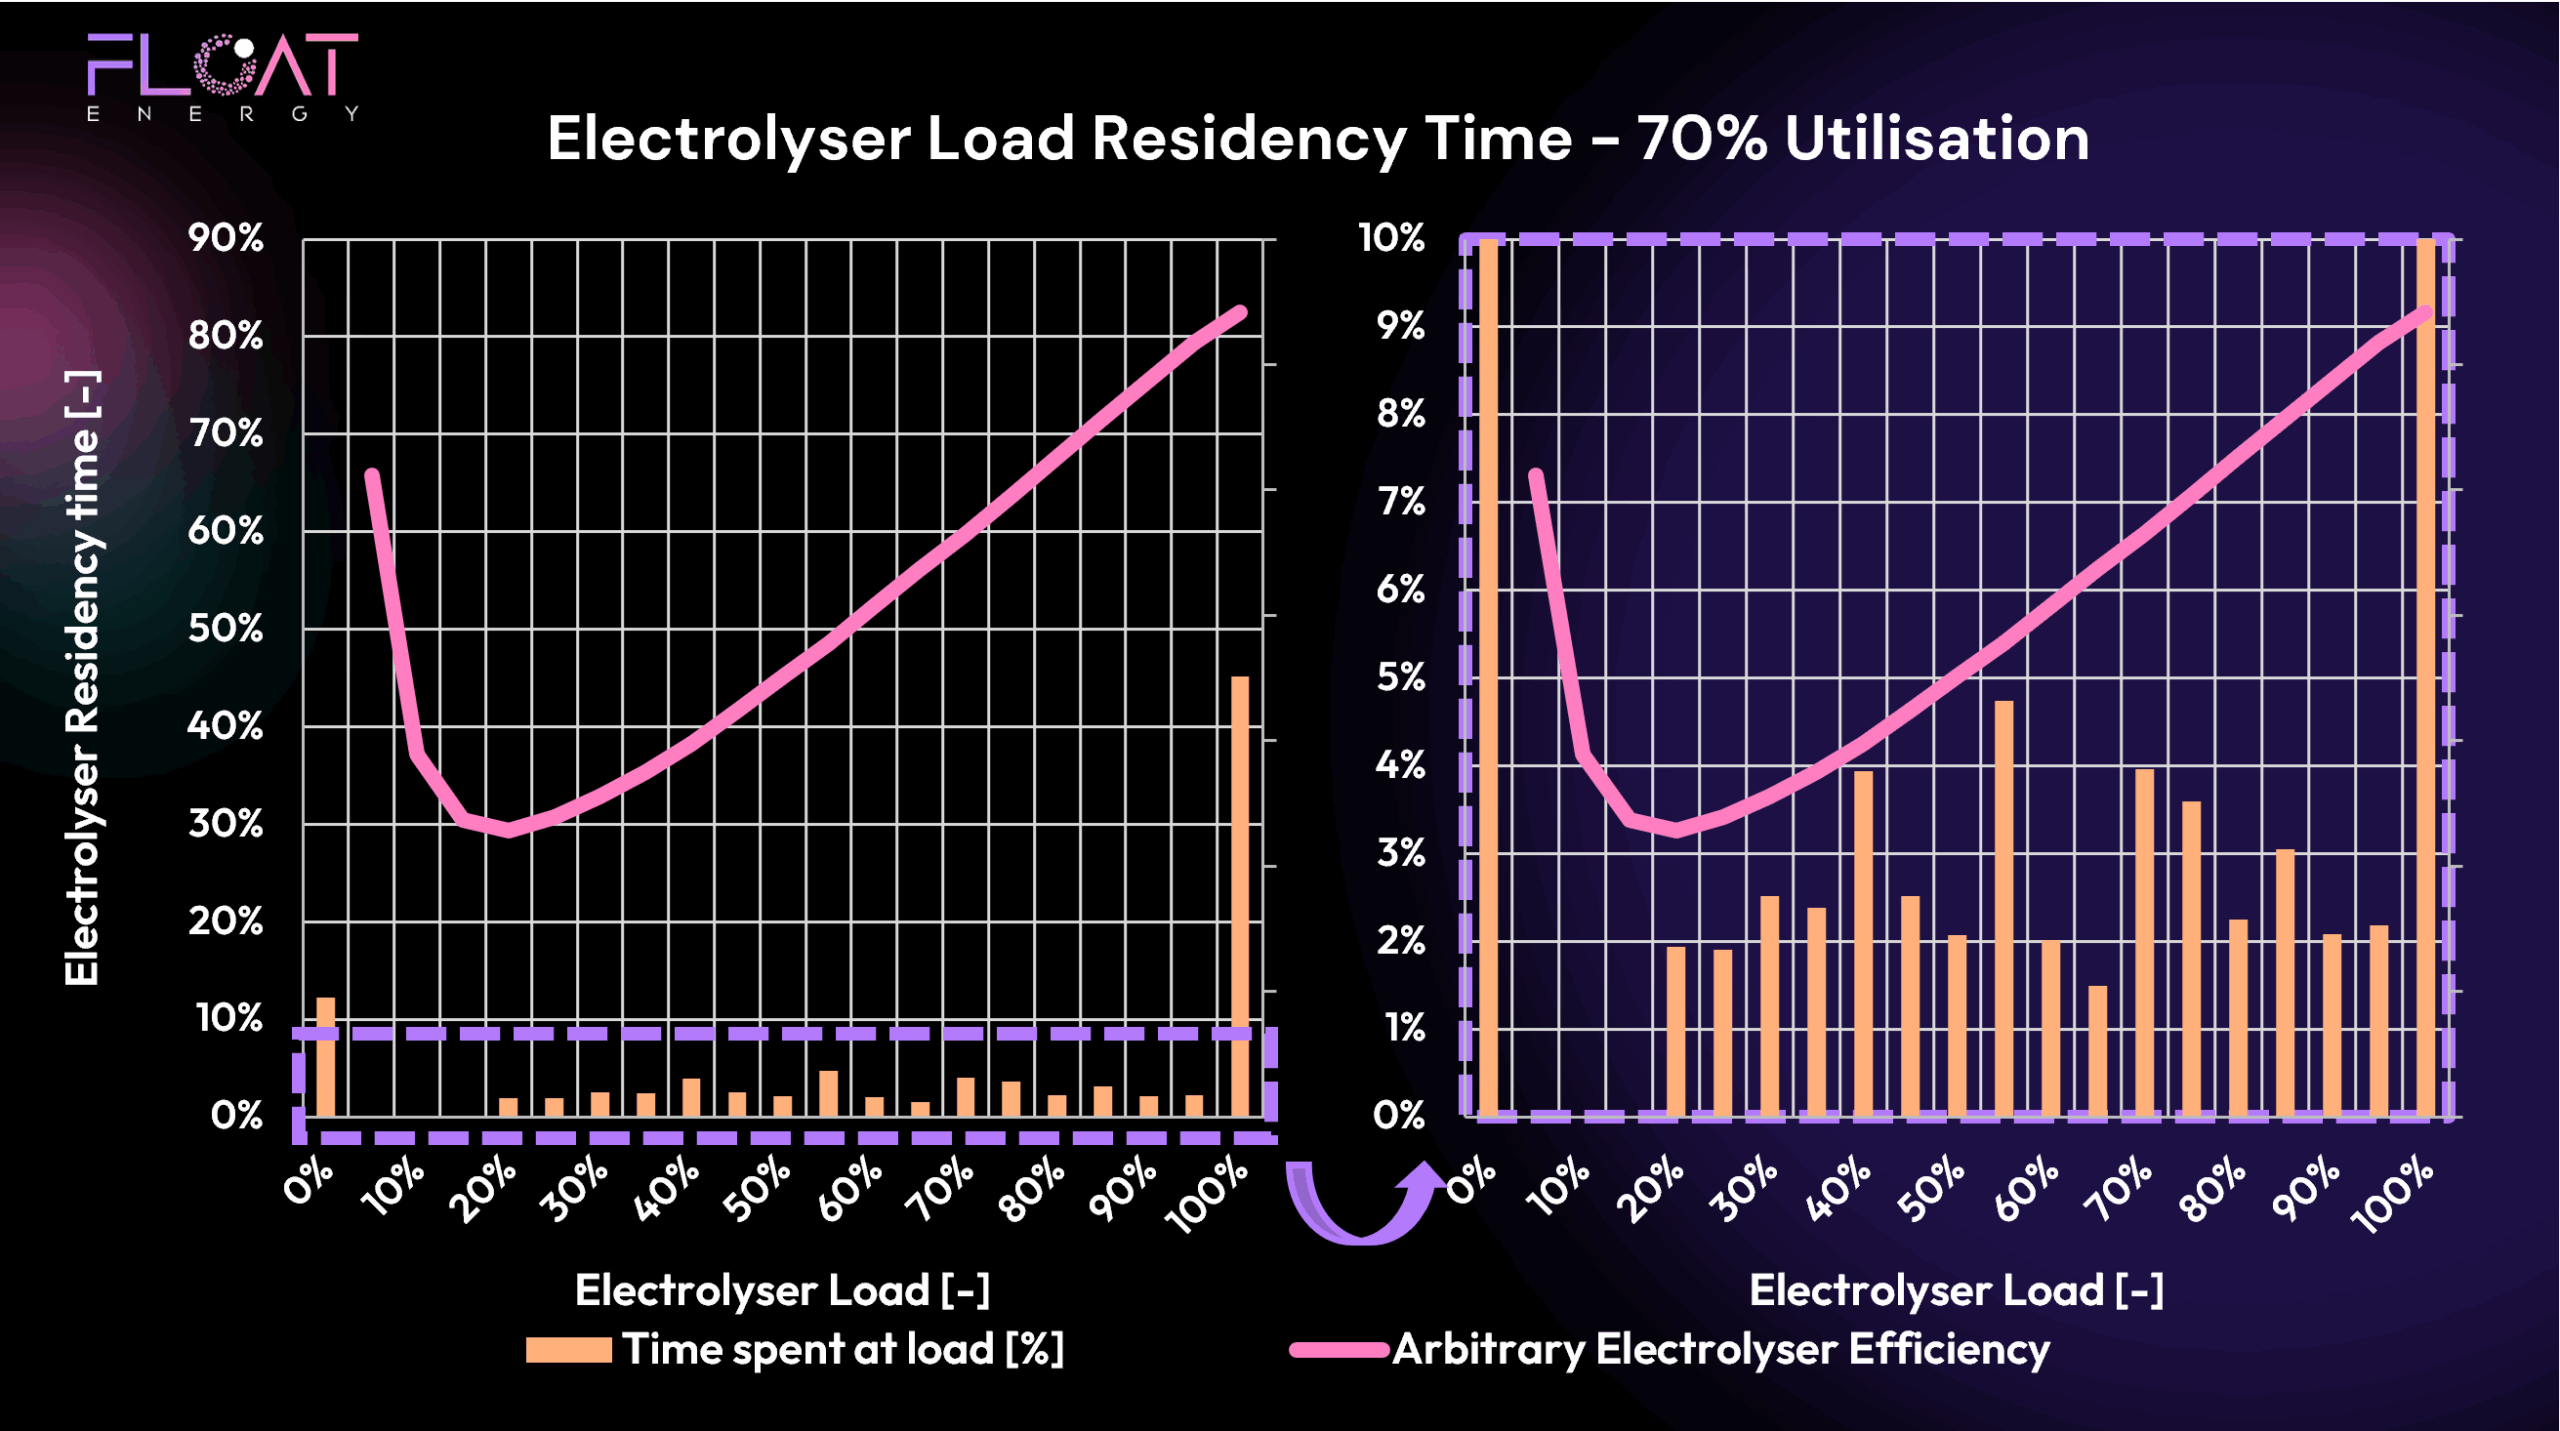
Now for the nuance: you don’t only run at full load.
Even at 90% annual utilisation, the optimiser spends time at 60%, 70%, 80% — and even dips down to 30–50% in certain periods.
That’s because:
- Price dips don’t always last long enough for a full cycle
- CO₂ intensity rules may limit the run hours
- Storage, ramping limits, and the electrolyser warranty introduce constraints
This is where efficiency at part load matters. You might spend 30–40% of the year at partial load. This isn’t an insignificant amount of time. When power prices allow, small efficiency gains can make a difference.
So, it’s not about picking efficiency at one load. It’s about understanding how your efficiency curve interacts with your dispatch profile over a full year.
So What’s the Right Strategy?
The most cost-effective electrolyser dispatch usually comes from combining:
 Full-load operation when power is cheap Part-load flexibility to stretch value and meet constraints Smart shutdowns when prices peak and electrolyser warranty allows
This is why FLOAT Energy’s optimisation engine includes:
- Load-dependent efficiency curves
- Power price forecasts across all markets
- Startup/shutdown cost modelling
- Real-time dispatch optimisation
Final Thought: Optimise the Curve, Not Just the Point
Hydrogen plants don’t operate at one fixed load. They move. Flex with price. Respond to demand. The load curve shows this:
You don’t always run at full load — and even when you do, the rest of the curve still matters.
Finally, our optimiser generates more value from switching off the electrolyser rather than running at part load or close to turndown. So in a future blog we’ll take a look at turndown.
FLOAT’s optimiser helps you capture value across the full range of possible operations — not just in ideal conditions, but in real, market-driven dispatch.
Let us show you how.