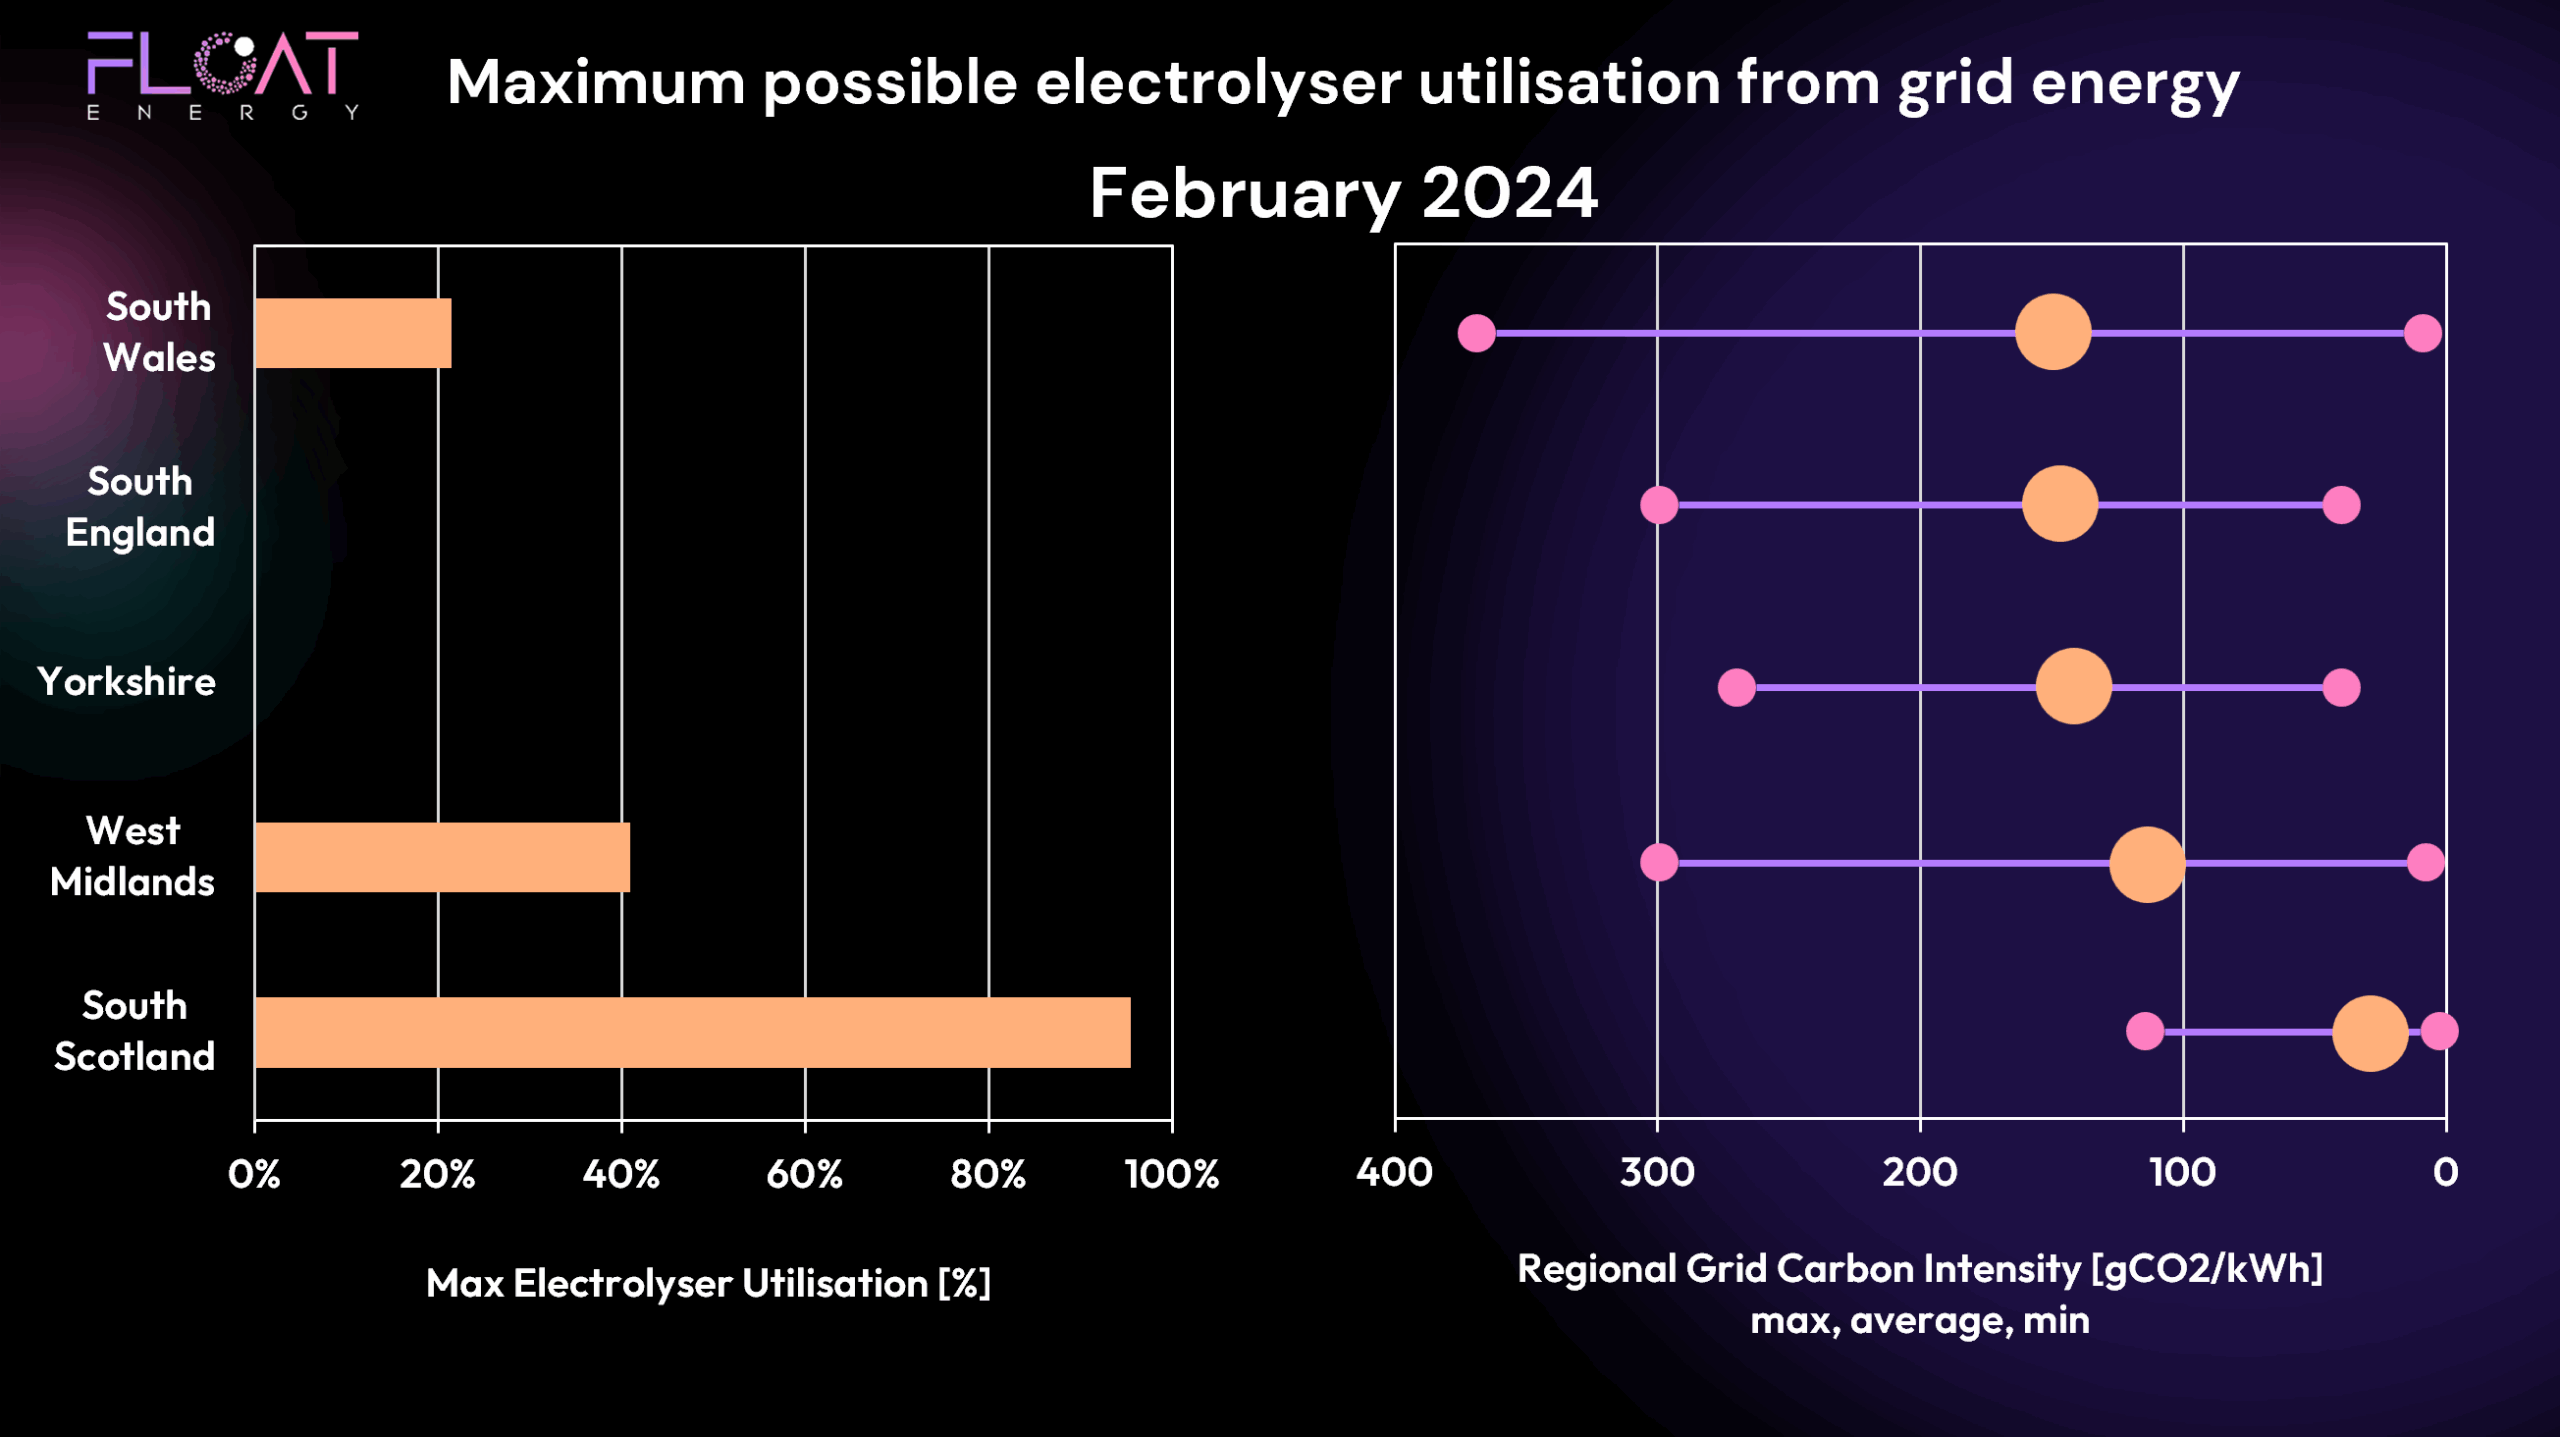

In our last blog, we looked at how much hydrogen you could produce using grid electricity alone — a useful baseline, but not the full picture. Because if your goal is to comply with the UK Low Carbon Hydrogen Standard (LCHS), then where you’re located and what your local grid CO₂ intensity looks like becomes essential.
So how much PPA capacity do you really need? What generation types should you contract with? Does it matter where your PPAs are located? And can you still optimise for cost while remaining compliant?
Let’s dive in.
Grid CO₂ Matters — A Lot
The UK LCHS mandates a carbon intensity threshold of 20 gCO₂ per MJ of hydrogen. That’s not a lot. And depending on where you are in the UK, your ability to stay under that threshold using grid power alone can vary dramatically.
Take a look at the CO₂ graph below:
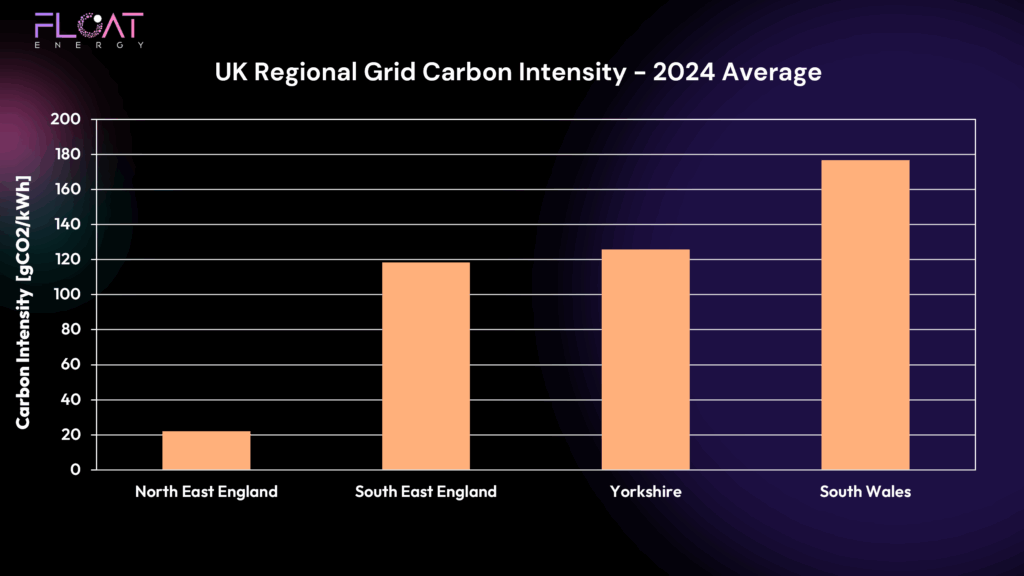
This shows the average CO₂ intensity of grid electricity in four UK regions. North East England has a relatively clean grid — meaning electrolytic hydrogen producers there can operate almost unconstrained without exceeding LCHS limits. But South Wales? Not so lucky.
This means producers in higher CO₂ regions face a constraint: if they want higher utilisation, they’ll need to blend in renewable energy from Power Purchase Agreements (PPAs) to remain compliant.
How PPAs Help — But at a Cost
PPAs let hydrogen producers “green” their energy mix by contracting directly with renewable generators. But they also come with costs. Lets look at some facts:
The average wholesale price in 2024 was ~£75–80/MWh.
Meanwhile, we can estimate PPA prices from data such as CfD strike prices from the latest allocation rounds:
- Wind: £81.50/MWh
- Solar: £75.00/MWh
- Nuclear: £125.00/MWh (!)
PPA prices are usually at a premium due to their green credentials, even if they offer some of the lowest LCOE (levelised cost of energy)
In reality though, renewables are cannibalising each other. When the wind blows, grid prices crash. In fact, it can be cheaper — or even profitable — to consume from the grid than from your fixed-price PPA. So, for 2024 data (which we’re using here) the optimiser prefers grid power when it can. In future years volatility could cause price spikes which makes having an optimiser in your hydrogen project more valuable!
But if the grid’s too carbon-intensive when you need it, a PPA might be your only route to compliance.
FLOAT’s Optimiser in Action
Using 2024 data, we modelled PPA requirements for hydrogen plants across four regions, under two scenarios:
Low utilisation (50%)
High utilisation (95%)
We also assumed a reasonable spread of generator types and locations were available to be contracted with. We’ve displayed them in a map below:
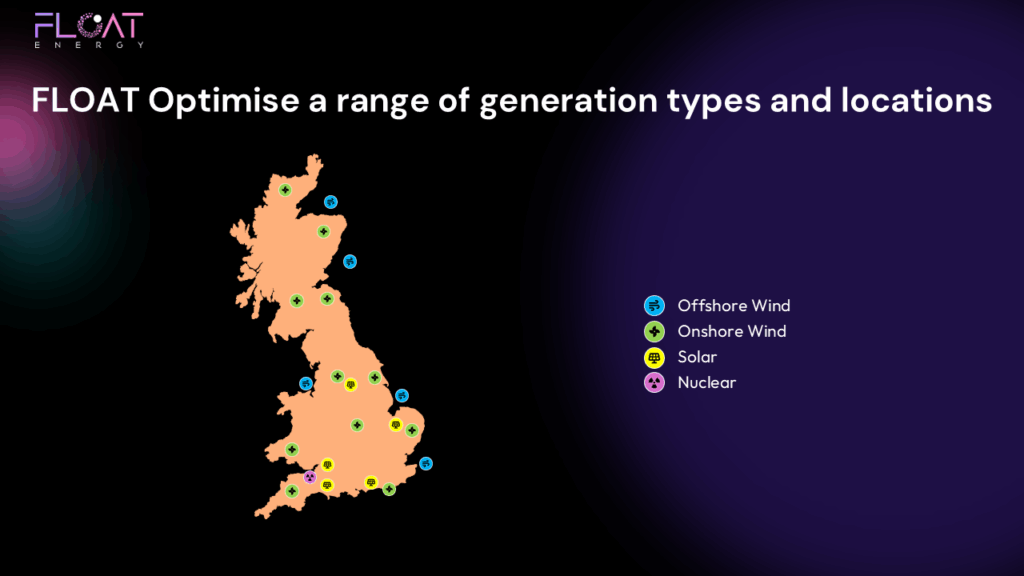
This reflects an example generator portfolio a project might have to chose from when conducting a RFQ for energy/PPAs. The results below show what generators the optimiser selected.
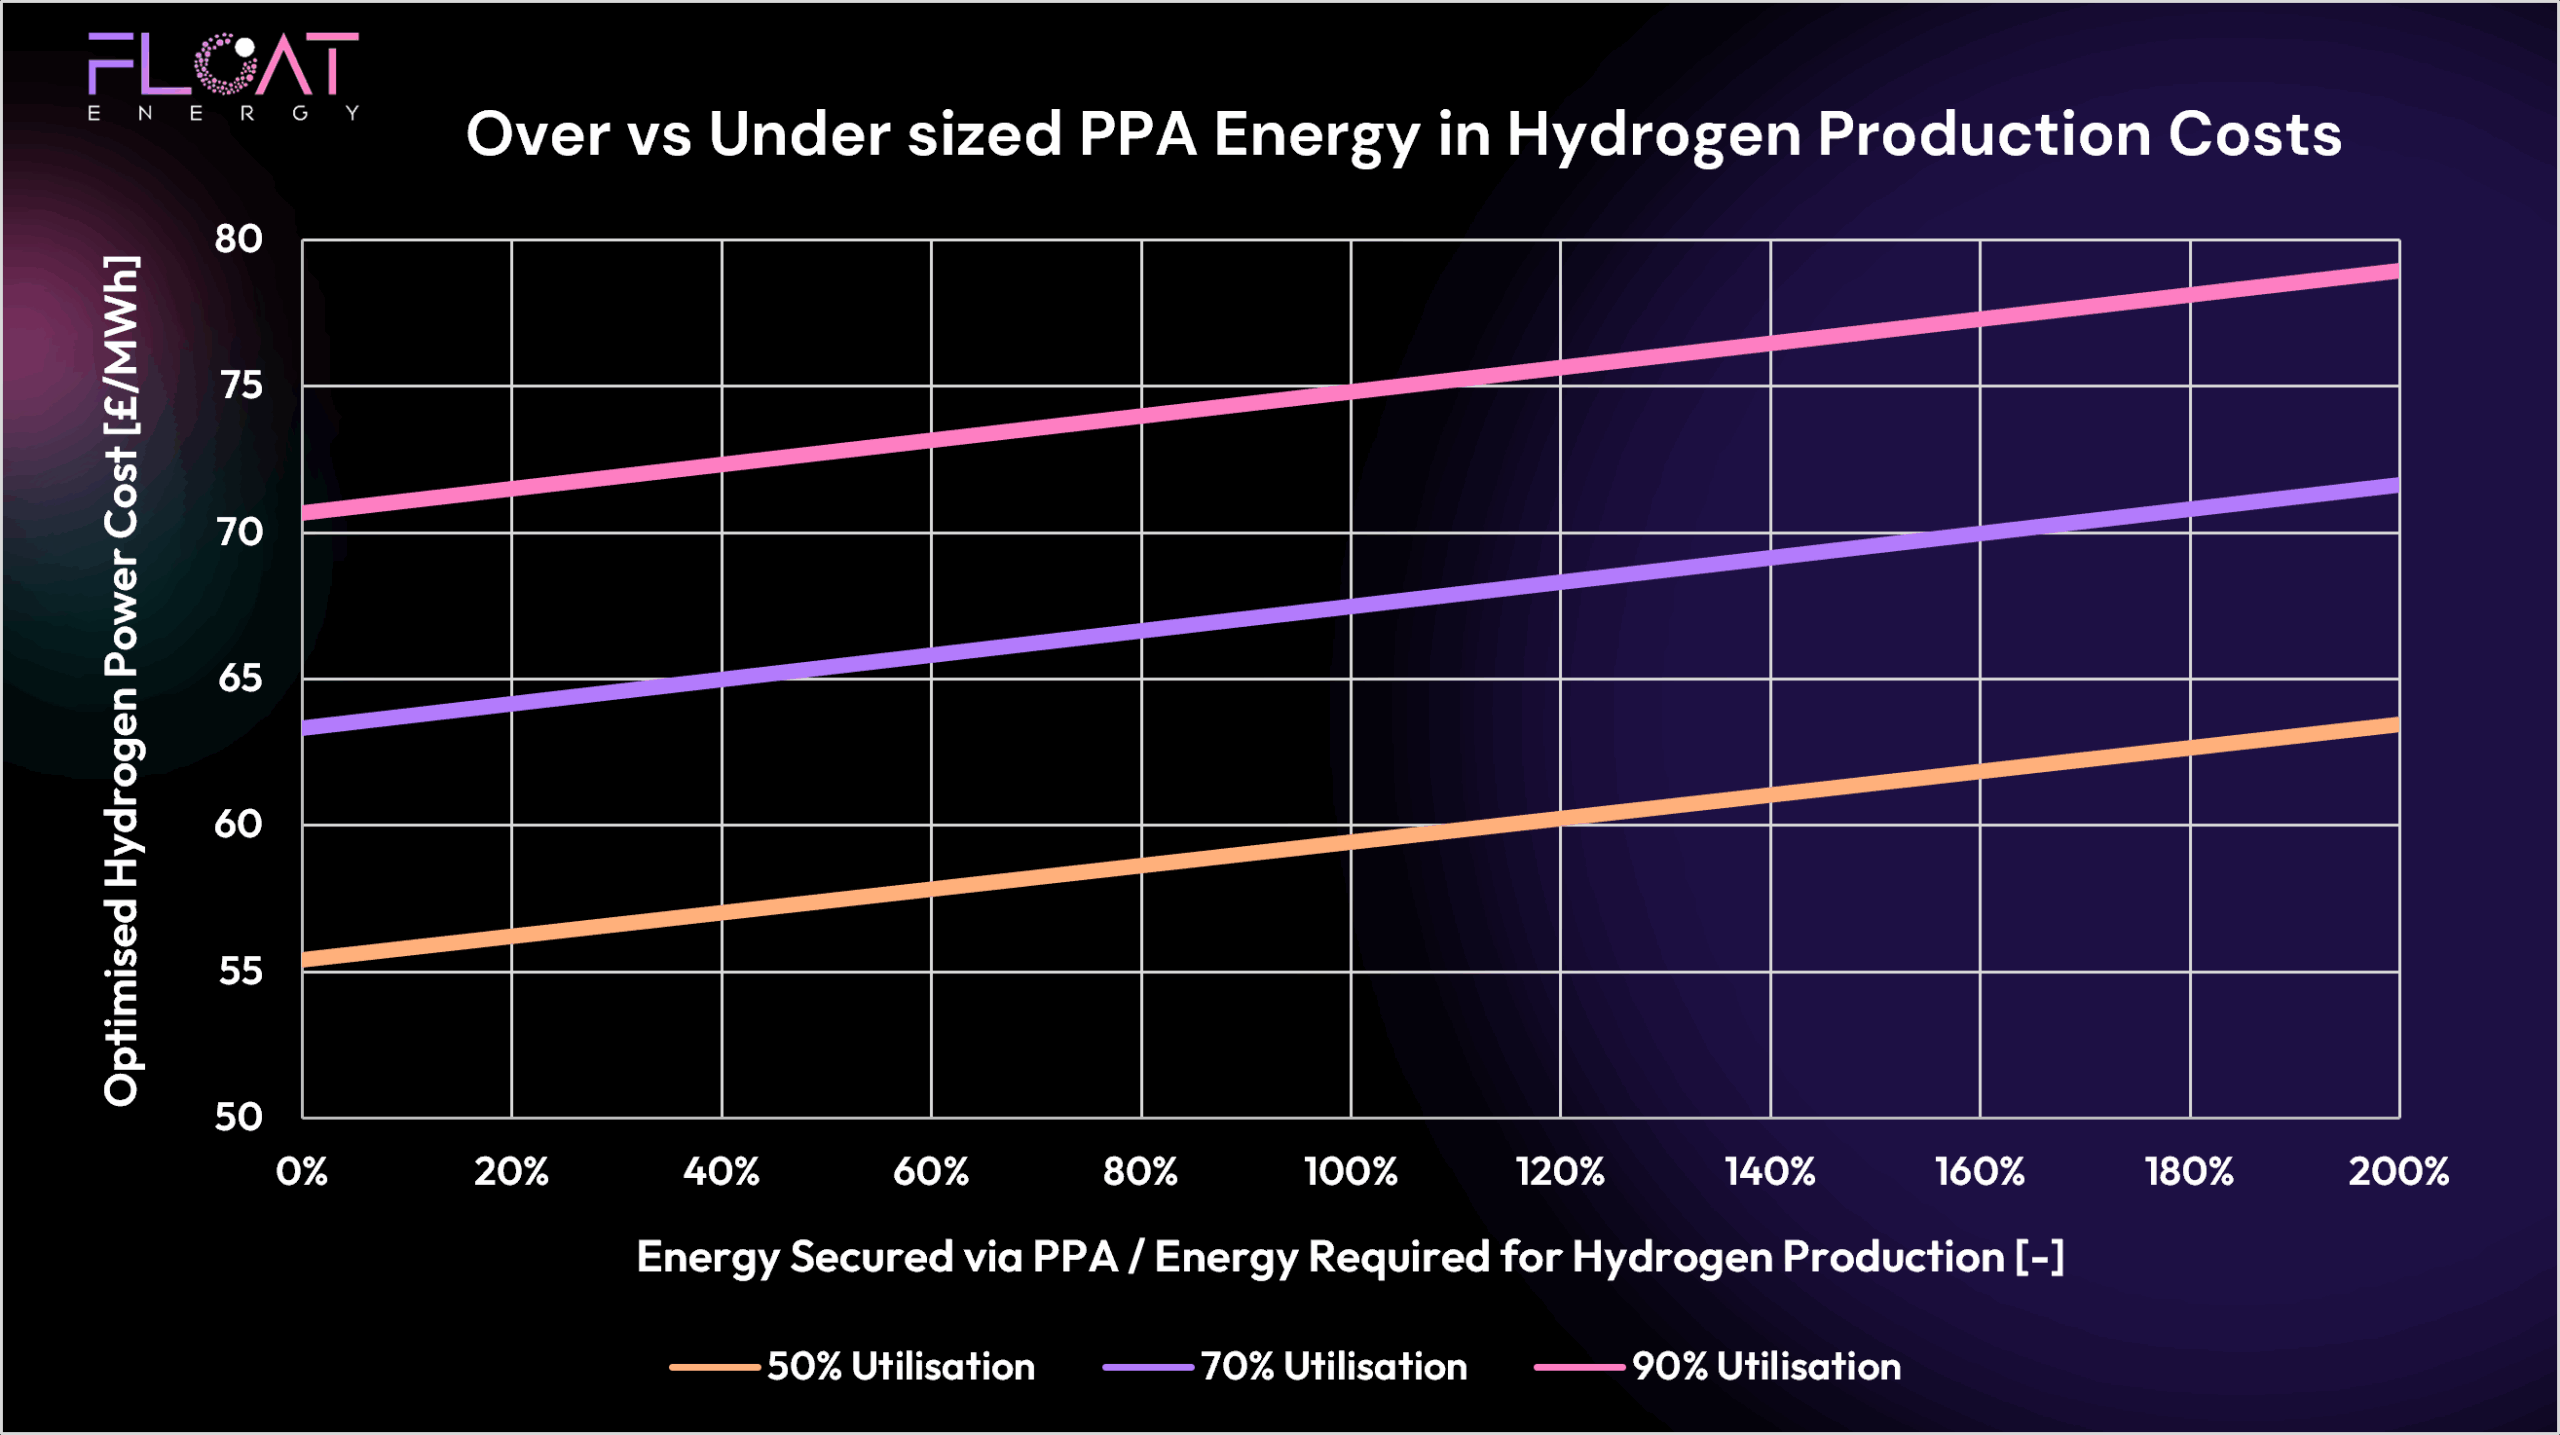
How Much Renewable Capacity Do You Need?
This graph shows the required PPA capacity as a multiple of the electrolyser capacity:
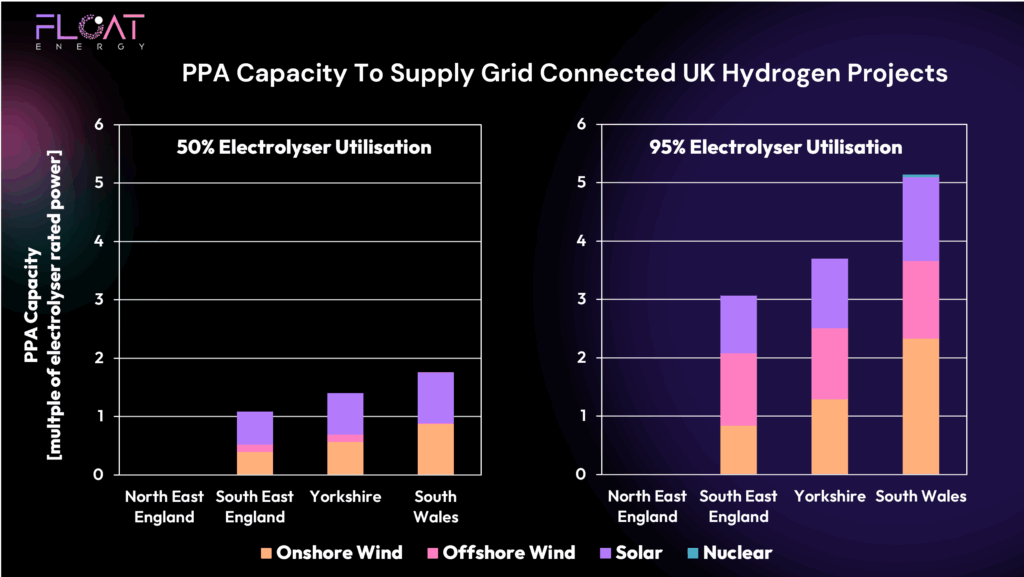
Some immediate insights:
Low CO₂ region (North East England):
- No PPA needed. The grid is clean enough for both low and high utilisation scenarios.
High CO₂ region (South Wales):
- Large PPA capacity required, especially at high utilisation — over 5x the plant’s capacity.
PPA needs scale with grid CO₂ and plant utilisation.
Nuclear is rarely selected due to high price.
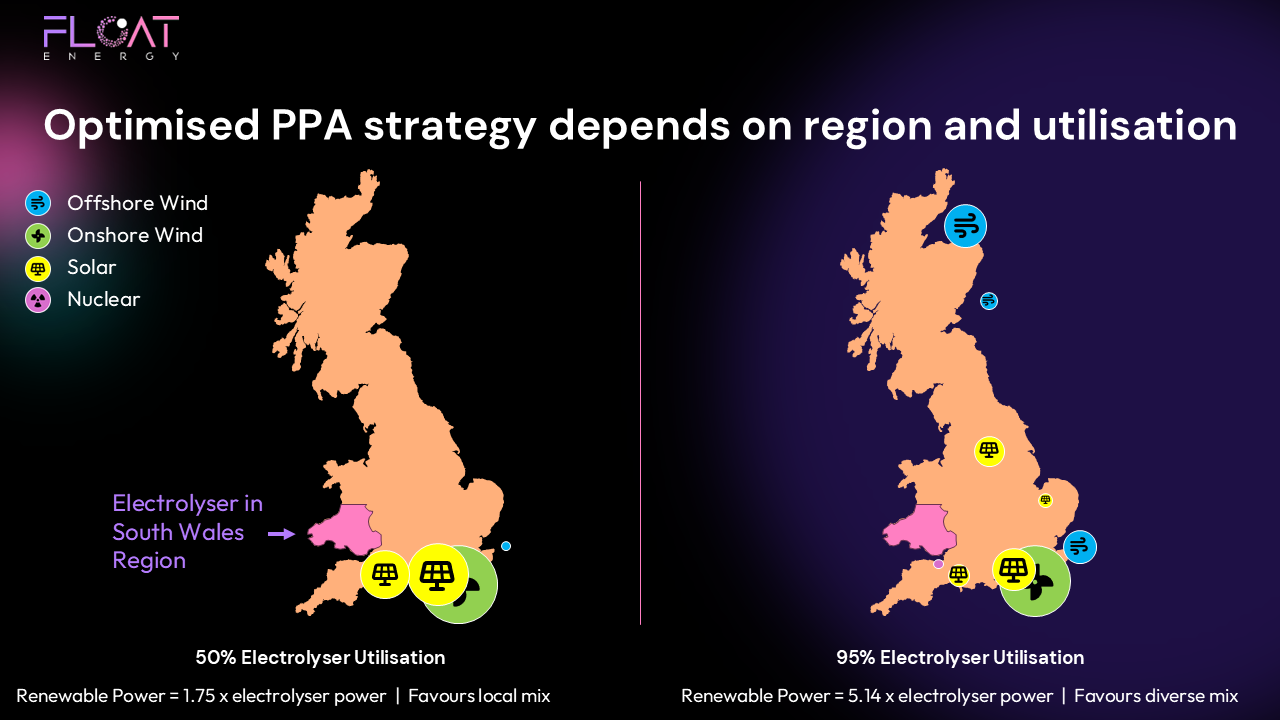
Local vs Diverse Mix: It Depends on Your Utilisation Target
The locational distribution of PPAs also changes dramatically depending on how hard you want to run your plant.
In the maps below we visualise the portfolio selected by the optimiser for a South Wales-based plant at two utilisation levels:

Low Utilisation (50%)
Here, the optimiser favours local, temporally correlated generators (e.g. onshore wind and solar in South Wales). Why?
Because even though the grid might offer cheap energy when the wind blows, it might still be too carbon-intensive. So to stay compliant, the optimiser tops up with the smallest amount of renewables that correlate with regional CO₂ dips.
Since there are no offshore wind farms in South Wales, importing offshore wind via PPA doesn’t improve compliance — its generation isn’t correlated with the local grid CO₂.
High Utilisation (95%)
At higher utilisation, the game changes.
To run nearly constantly, you need diversity: different generation types and different locations. Even if that means more expensive PPAs or less optimal correlation.
So the optimiser expands its portfolio:
- Some local generators still feature
- But now we also see offshore wind, onshore wind and solar from different regions to improve supply consistency
The optimiser essentially builds a pseudo-balancing portfolio, trading off CO₂, availability, and cost.
Why Onshore Wind and Solar Sometimes Beats Offshore (regardless of price)
It might seem odd that at 50% utilisation, onshore wind and solar dominates even when priced identically to offshore wind. Offshore wind has higher capacity factors — so why not use it?
Because this is not just about how much power you get — it’s about when you get it.
- Offshore wind is less correlated with grid CO₂ in South Wales because there are no offshore wind farms in this region.
- Onshore wind and solar, on the other hand, better reflect regional generation patterns.
- Contracting with a offshore wind farm in this case would mean tapping into wind patterns across the north and east of the UK which differ from the wind patterns and therefore grid CO2 intensity in South Wales
So, the optimiser selects PPAs that most effectively reduce net CO₂ intensity, even if they don’t maximise raw energy output. If someone builds a offshore wind farm in South Wales then it might show more favourably in the selection.
What FLOAT Can Do for Hydrogen Producers
Choosing the right PPA isn’t just about finding the cheapest price or the greenest generator. It’s about system optimisation:
Where is your plant?
What is the grid CO₂ profile in that region?
What utilisation do you need to hit your offtake target?
How intermittent can your hydrogen supply be?
These are the kinds of questions FLOAT’s optimiser is built to answer. We take into account:
- Generator location and type
- Temporal correlation with your plant’s demand and the grid CO₂
- Market prices and CfD-style fixed prices
- Future scenarios across years
We help you design the ideal generation stack, simulate it over multiple market years, and then manage dispatch in real-time to ensure you hit the lowest possible energy cost while staying compliant with regulations like the UK LCHS.
Conclusion: There Is No One-Size-Fits-All PPA
Whether you’re aiming for 50% or 95% electrolyser utilisation, FLOAT can help you optimise across:
- CO₂ compliance
- Market cost
- PPA size and location
- Generator diversity
Yes — you can get to your desired hydrogen output with various PPA mixes, but there is clearly an optimal one. FLOAT helps you find it.
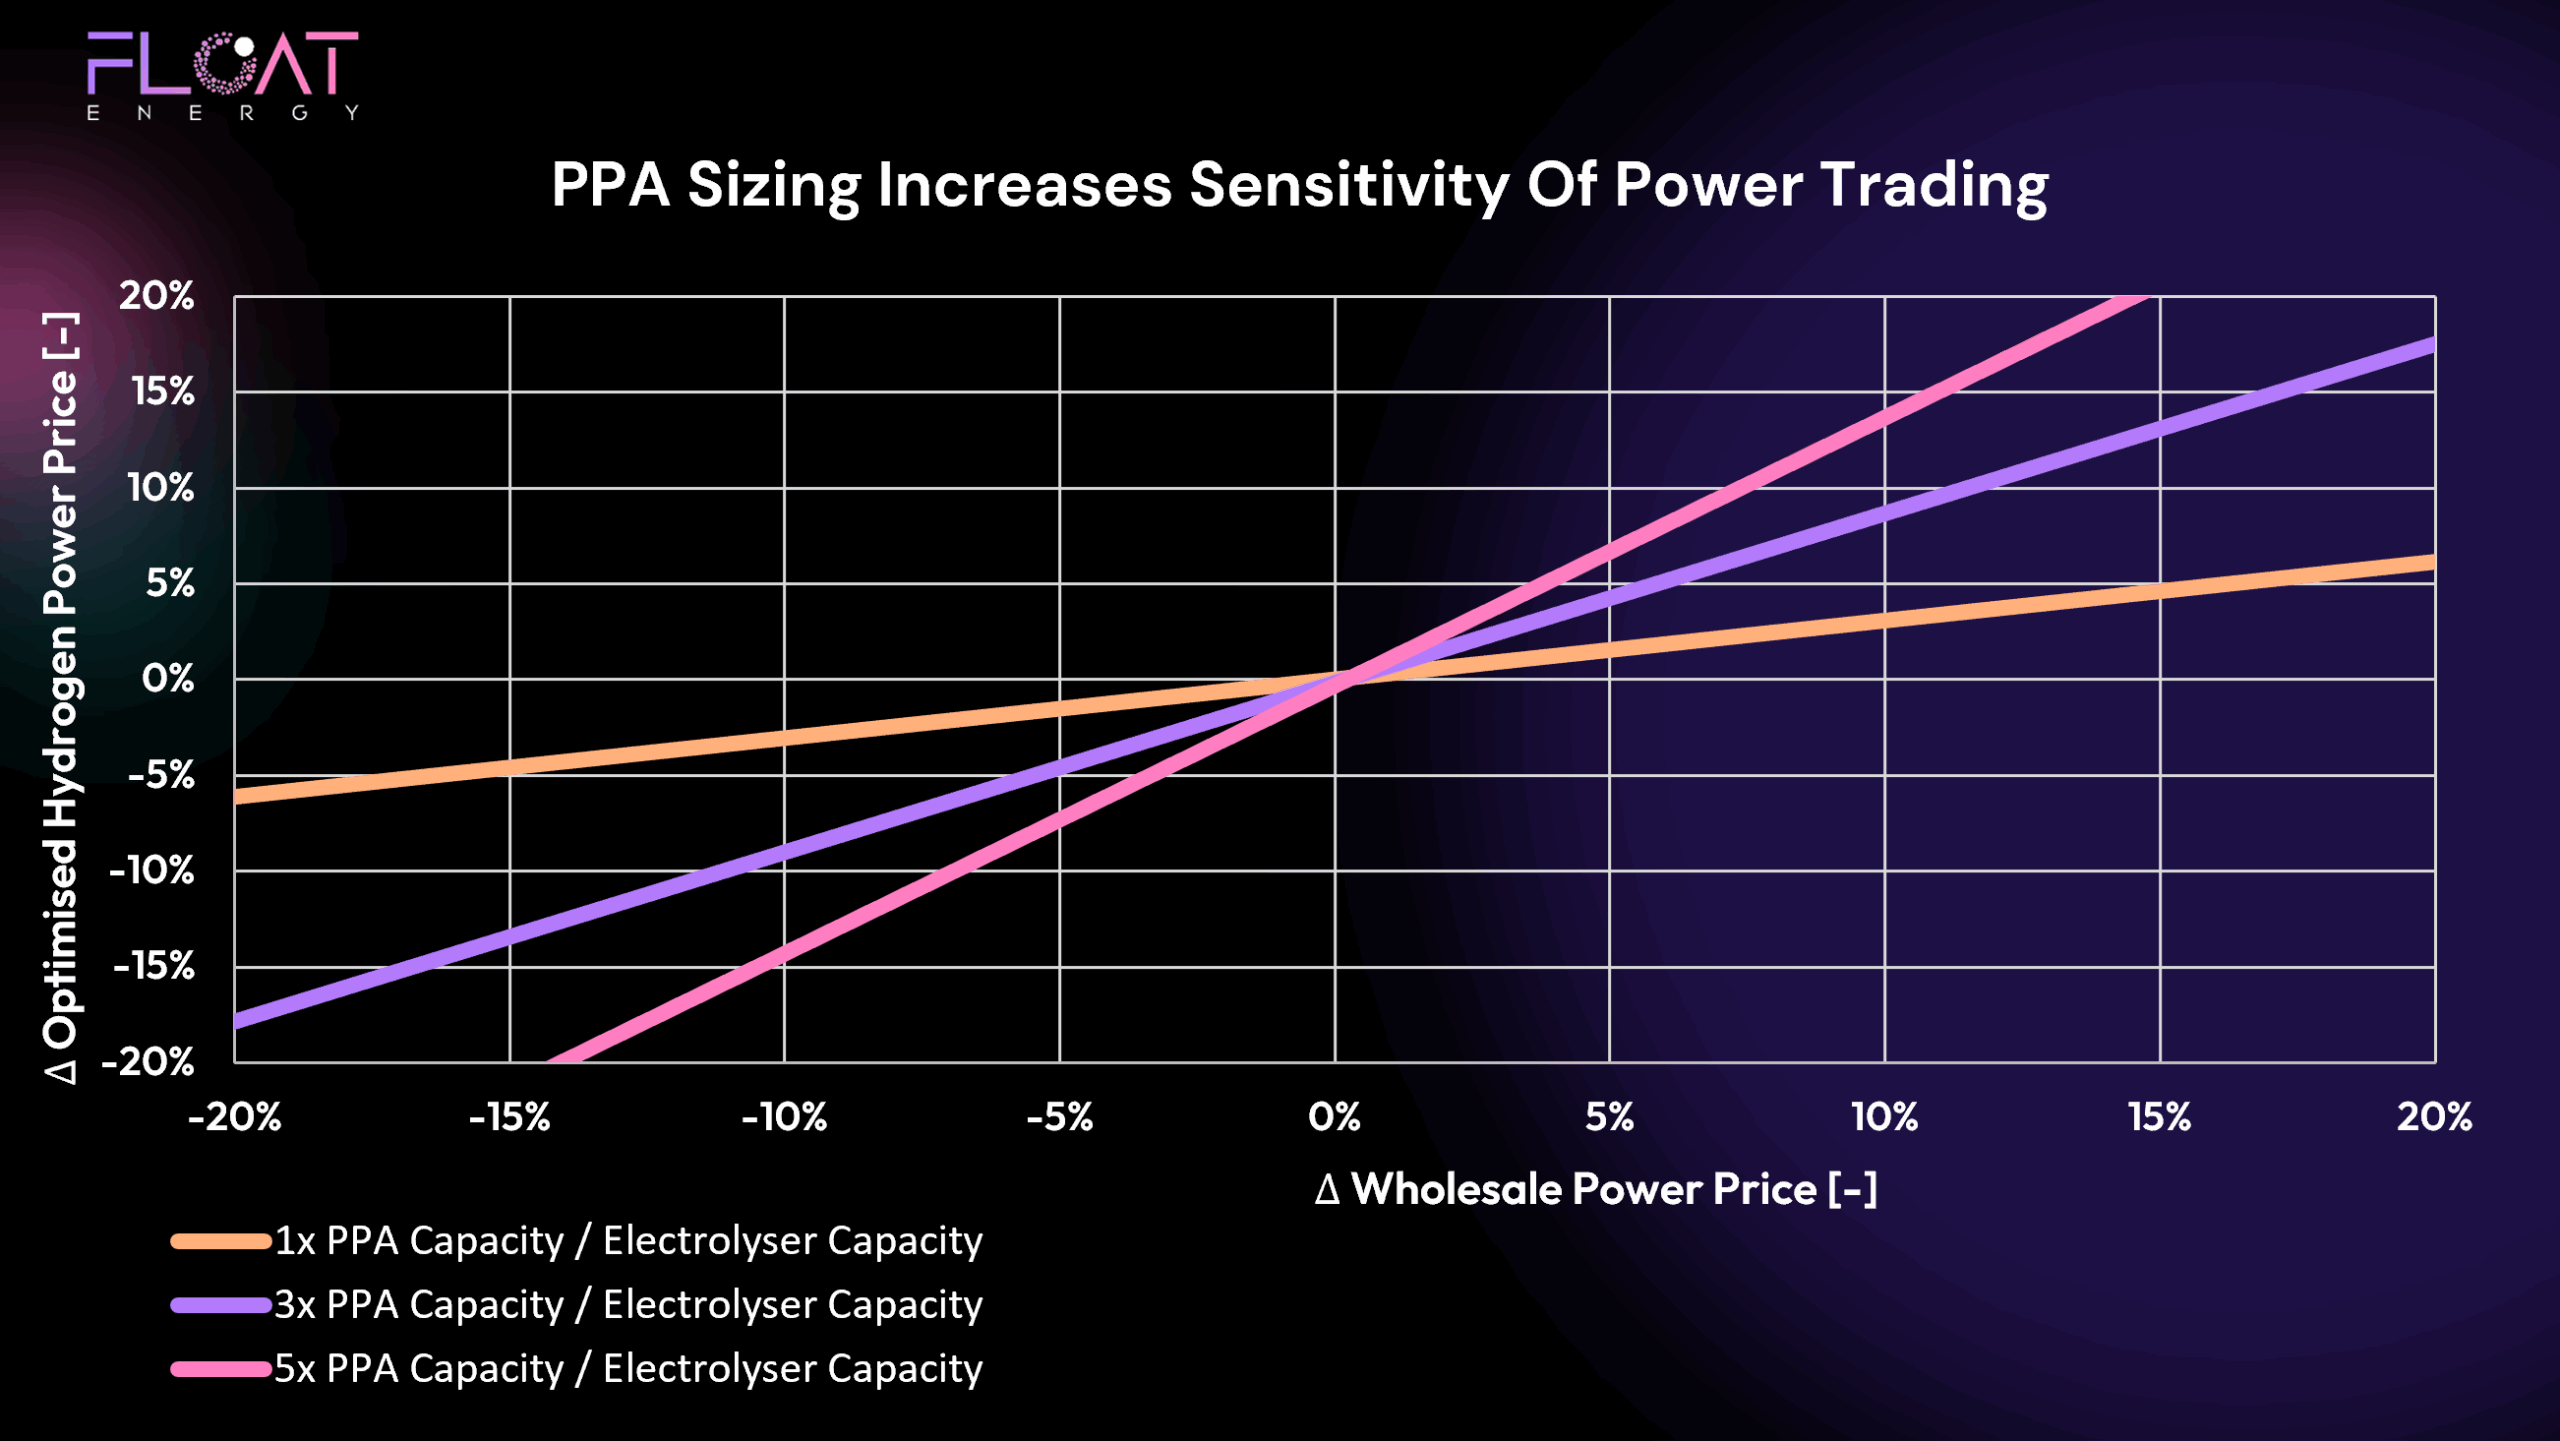
And one last question… If PPA costs are so high, what happens to hydrogen price if those prices come down? Or go up?