
FLOAT Hydrogen Power Optimiser: Capturing Opportunity as Markets Shift
March 2025 brought the first signs of relief in energy costs after a challenging start to the year. As wholesale markets softened slightly thanks to recovering renewables and easing grid stress, FLOAT’s optimiser successfully adapted, reducing hydrogen production costs while maintaining compliance with the UK Low Carbon Hydrogen Standard (LCHS).
For hydrogen producers navigating a complex and volatile energy market, March underscores the value of flexibility, optimisation, and a strategic approach to energy procurement — including how PPAs are used alongside wholesale market exposure.
March Market Context: Why Costs Fell
While structural challenges remain, March brought some easing of the pressures that defined January and February:
Gas Prices Eased Slightly
Norwegian outages cleared and storage withdrawals slowed, helping stabilise European gas markets. However, gas remained the marginal price setter, keeping wholesale power costs elevated relative to historic norms.
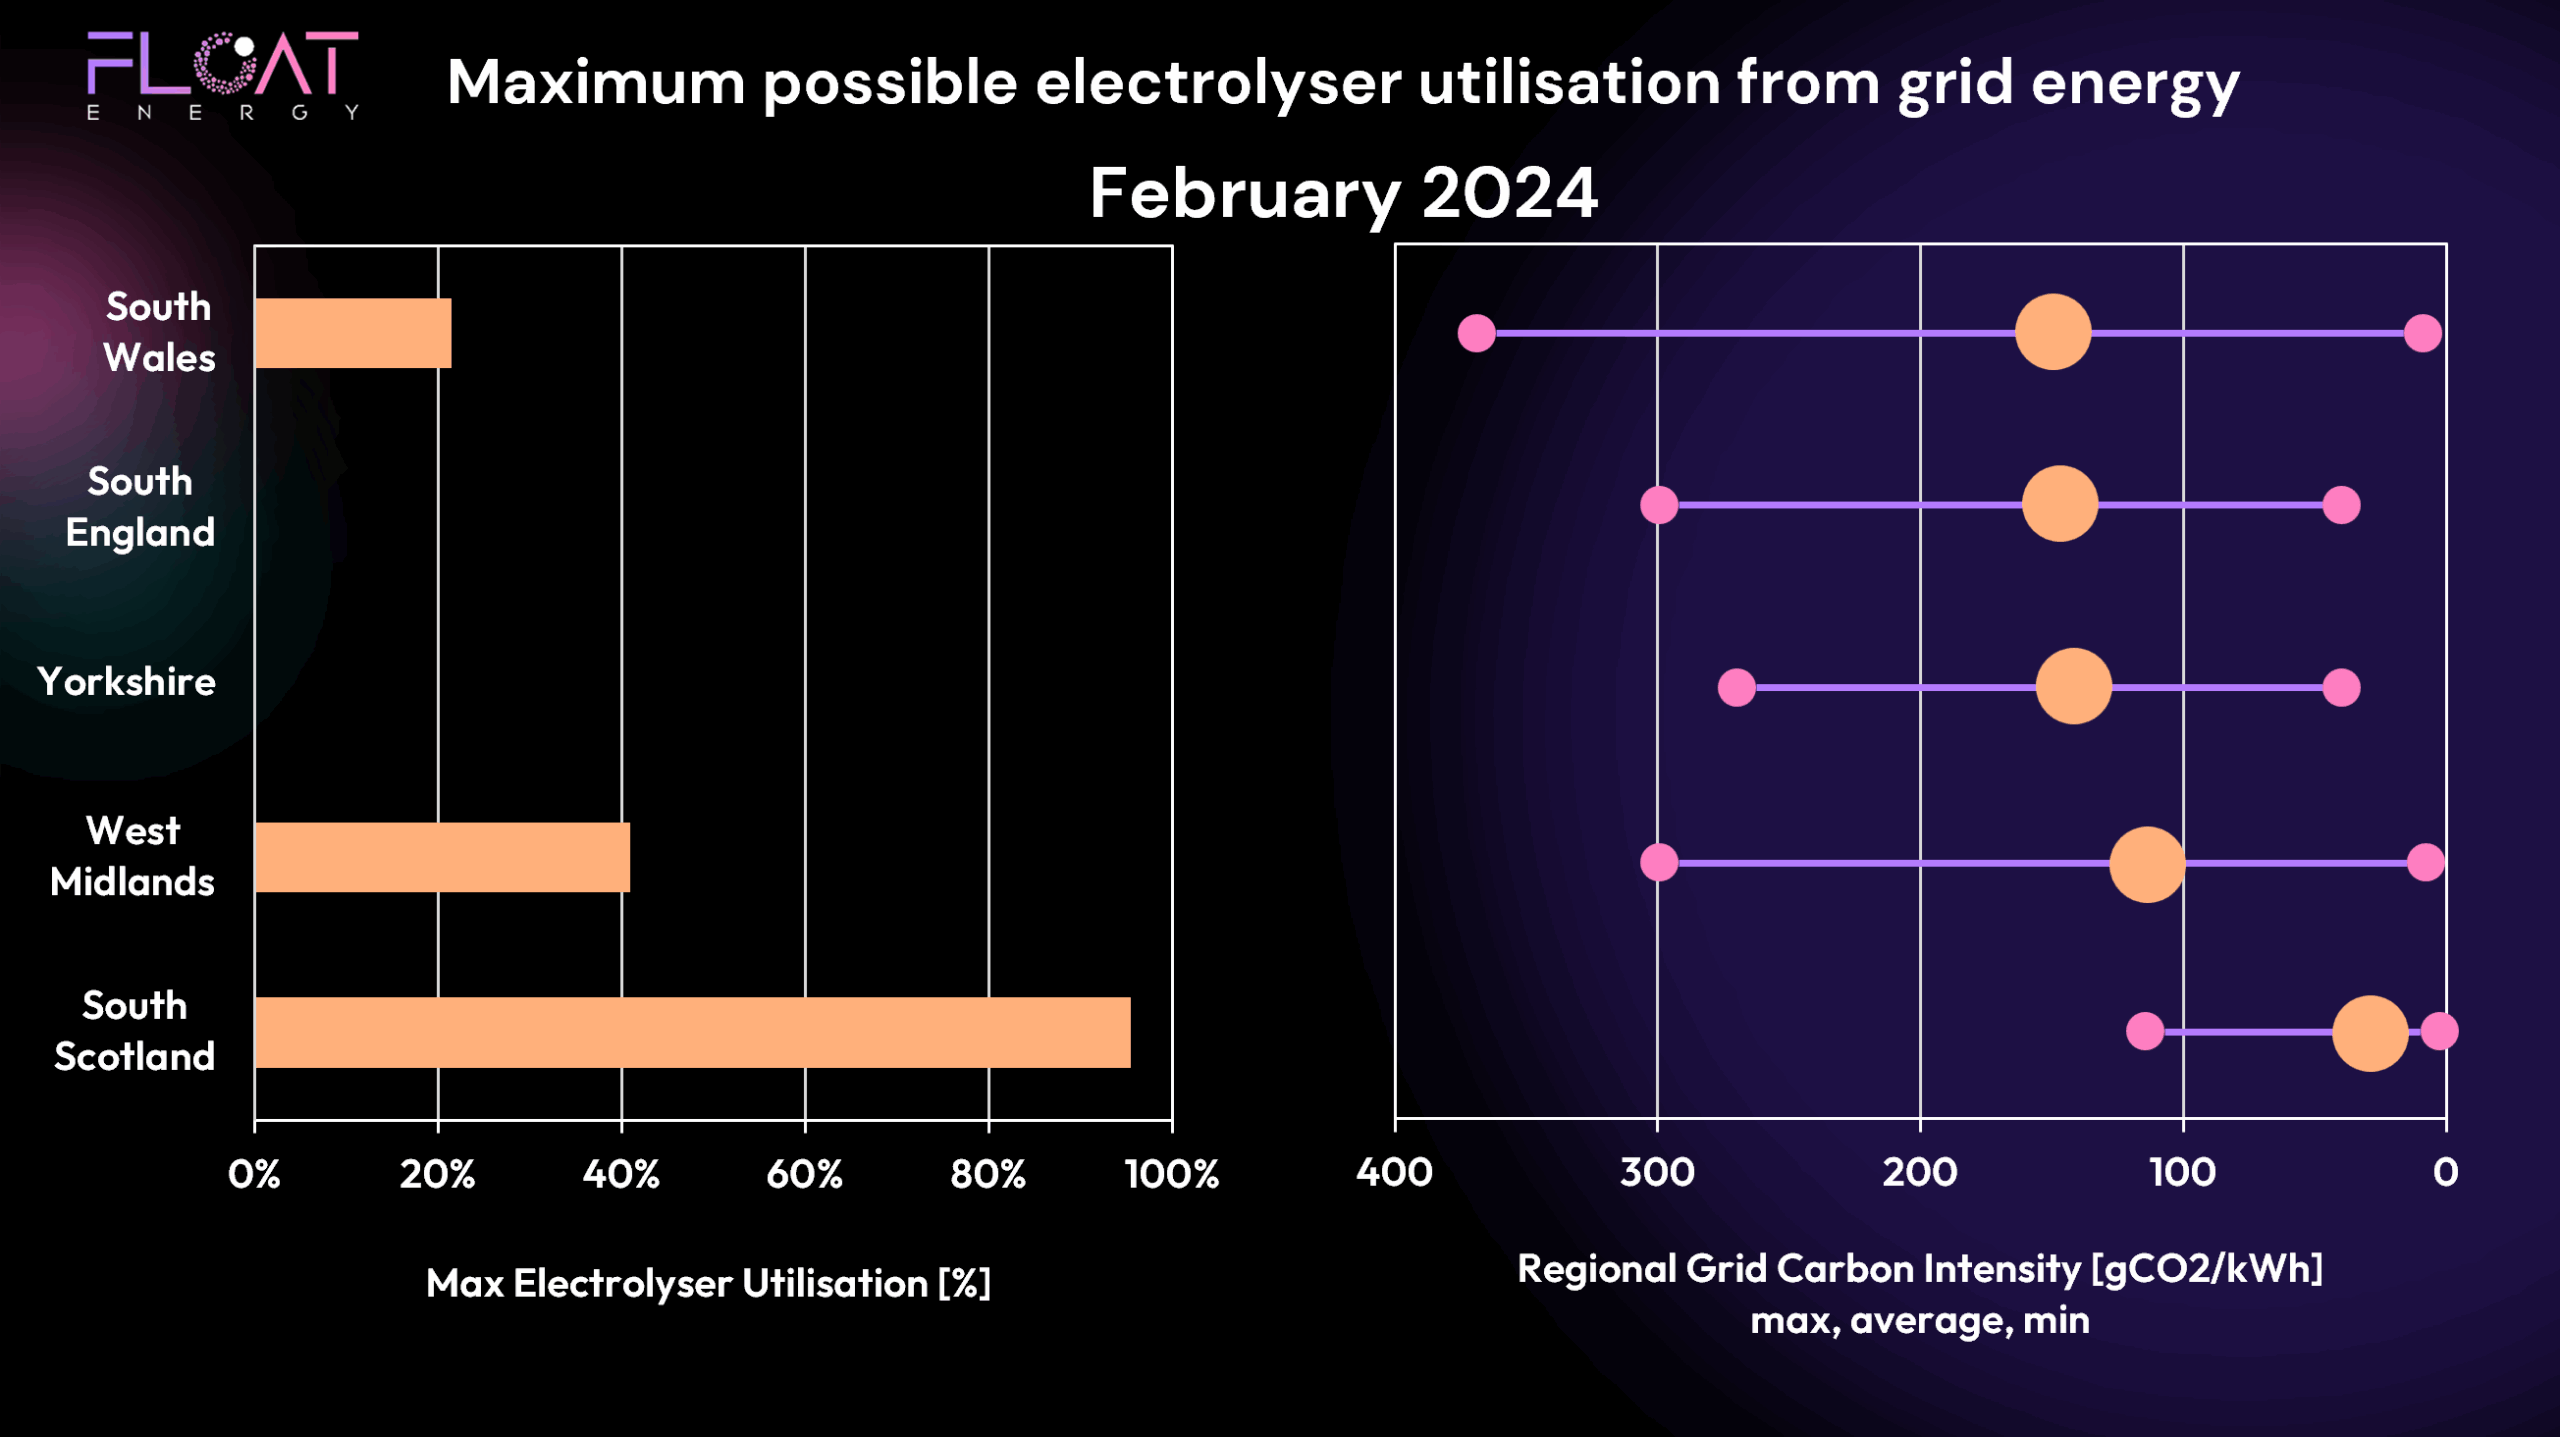
Renewables Rebounded Late in the Month
After a slow start, wind generation recovered later in March, reducing system stress and lowering day-ahead prices. These conditions created clear opportunities for optimisation.
Balancing Costs Lower, But Still Material
While the Balancing Mechanism remained active, March saw less extreme actions compared to the previous months, contributing to more stable wholesale prices.
FLOAT Optimiser Results – March 2025 Performance
💷 Energy Cost Performance
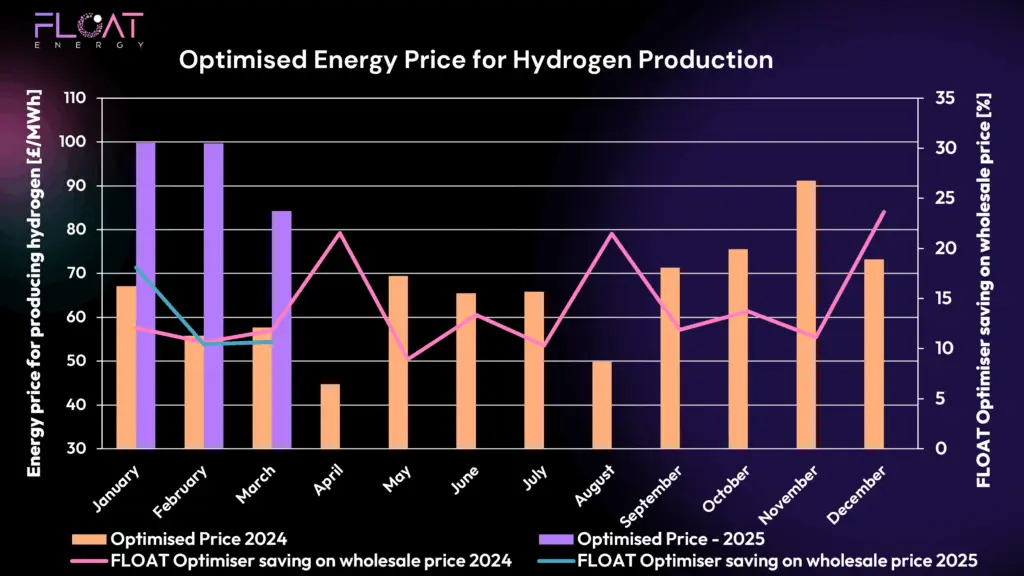
FLOAT’s optimiser delivered an average hydrogen production cost of £84/MWh in March, a meaningful improvement on the £100/MWh levels seen in January and February. As market conditions improved, FLOAT’s real-time optimisation adjusted to capture lower-cost operating windows.
This reinforces the importance of maintaining flexible market access alongside any fixed procurement strategies.
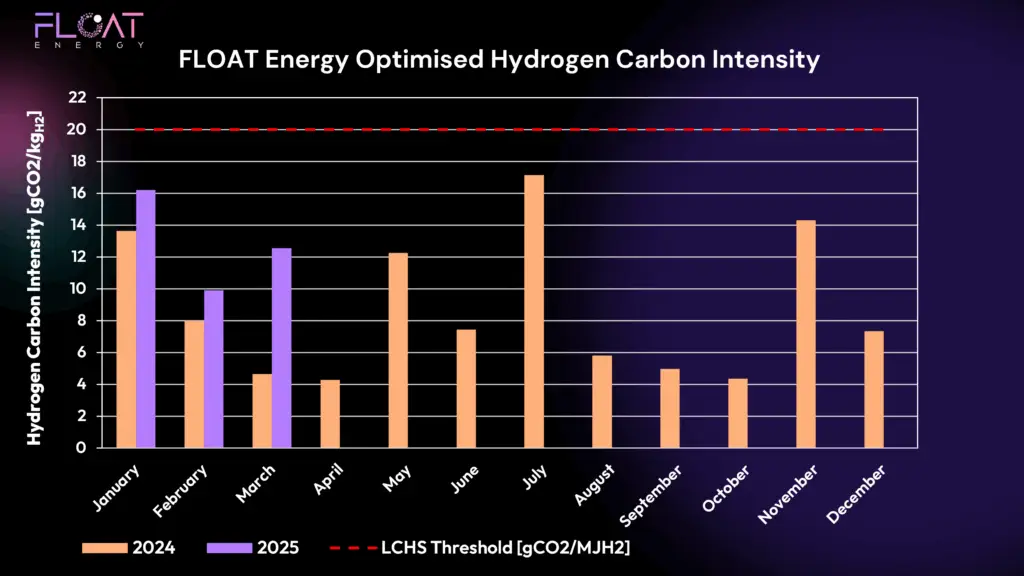
📉 Carbon Intensity Performance
Carbon intensity rose slightly to 12.5 gCO₂/MJH2, reflecting carbon-intensive grid conditions earlier in the month. However, the optimiser ensured production remained well within the 20 gCO₂/ MJH2 LCHS threshold.
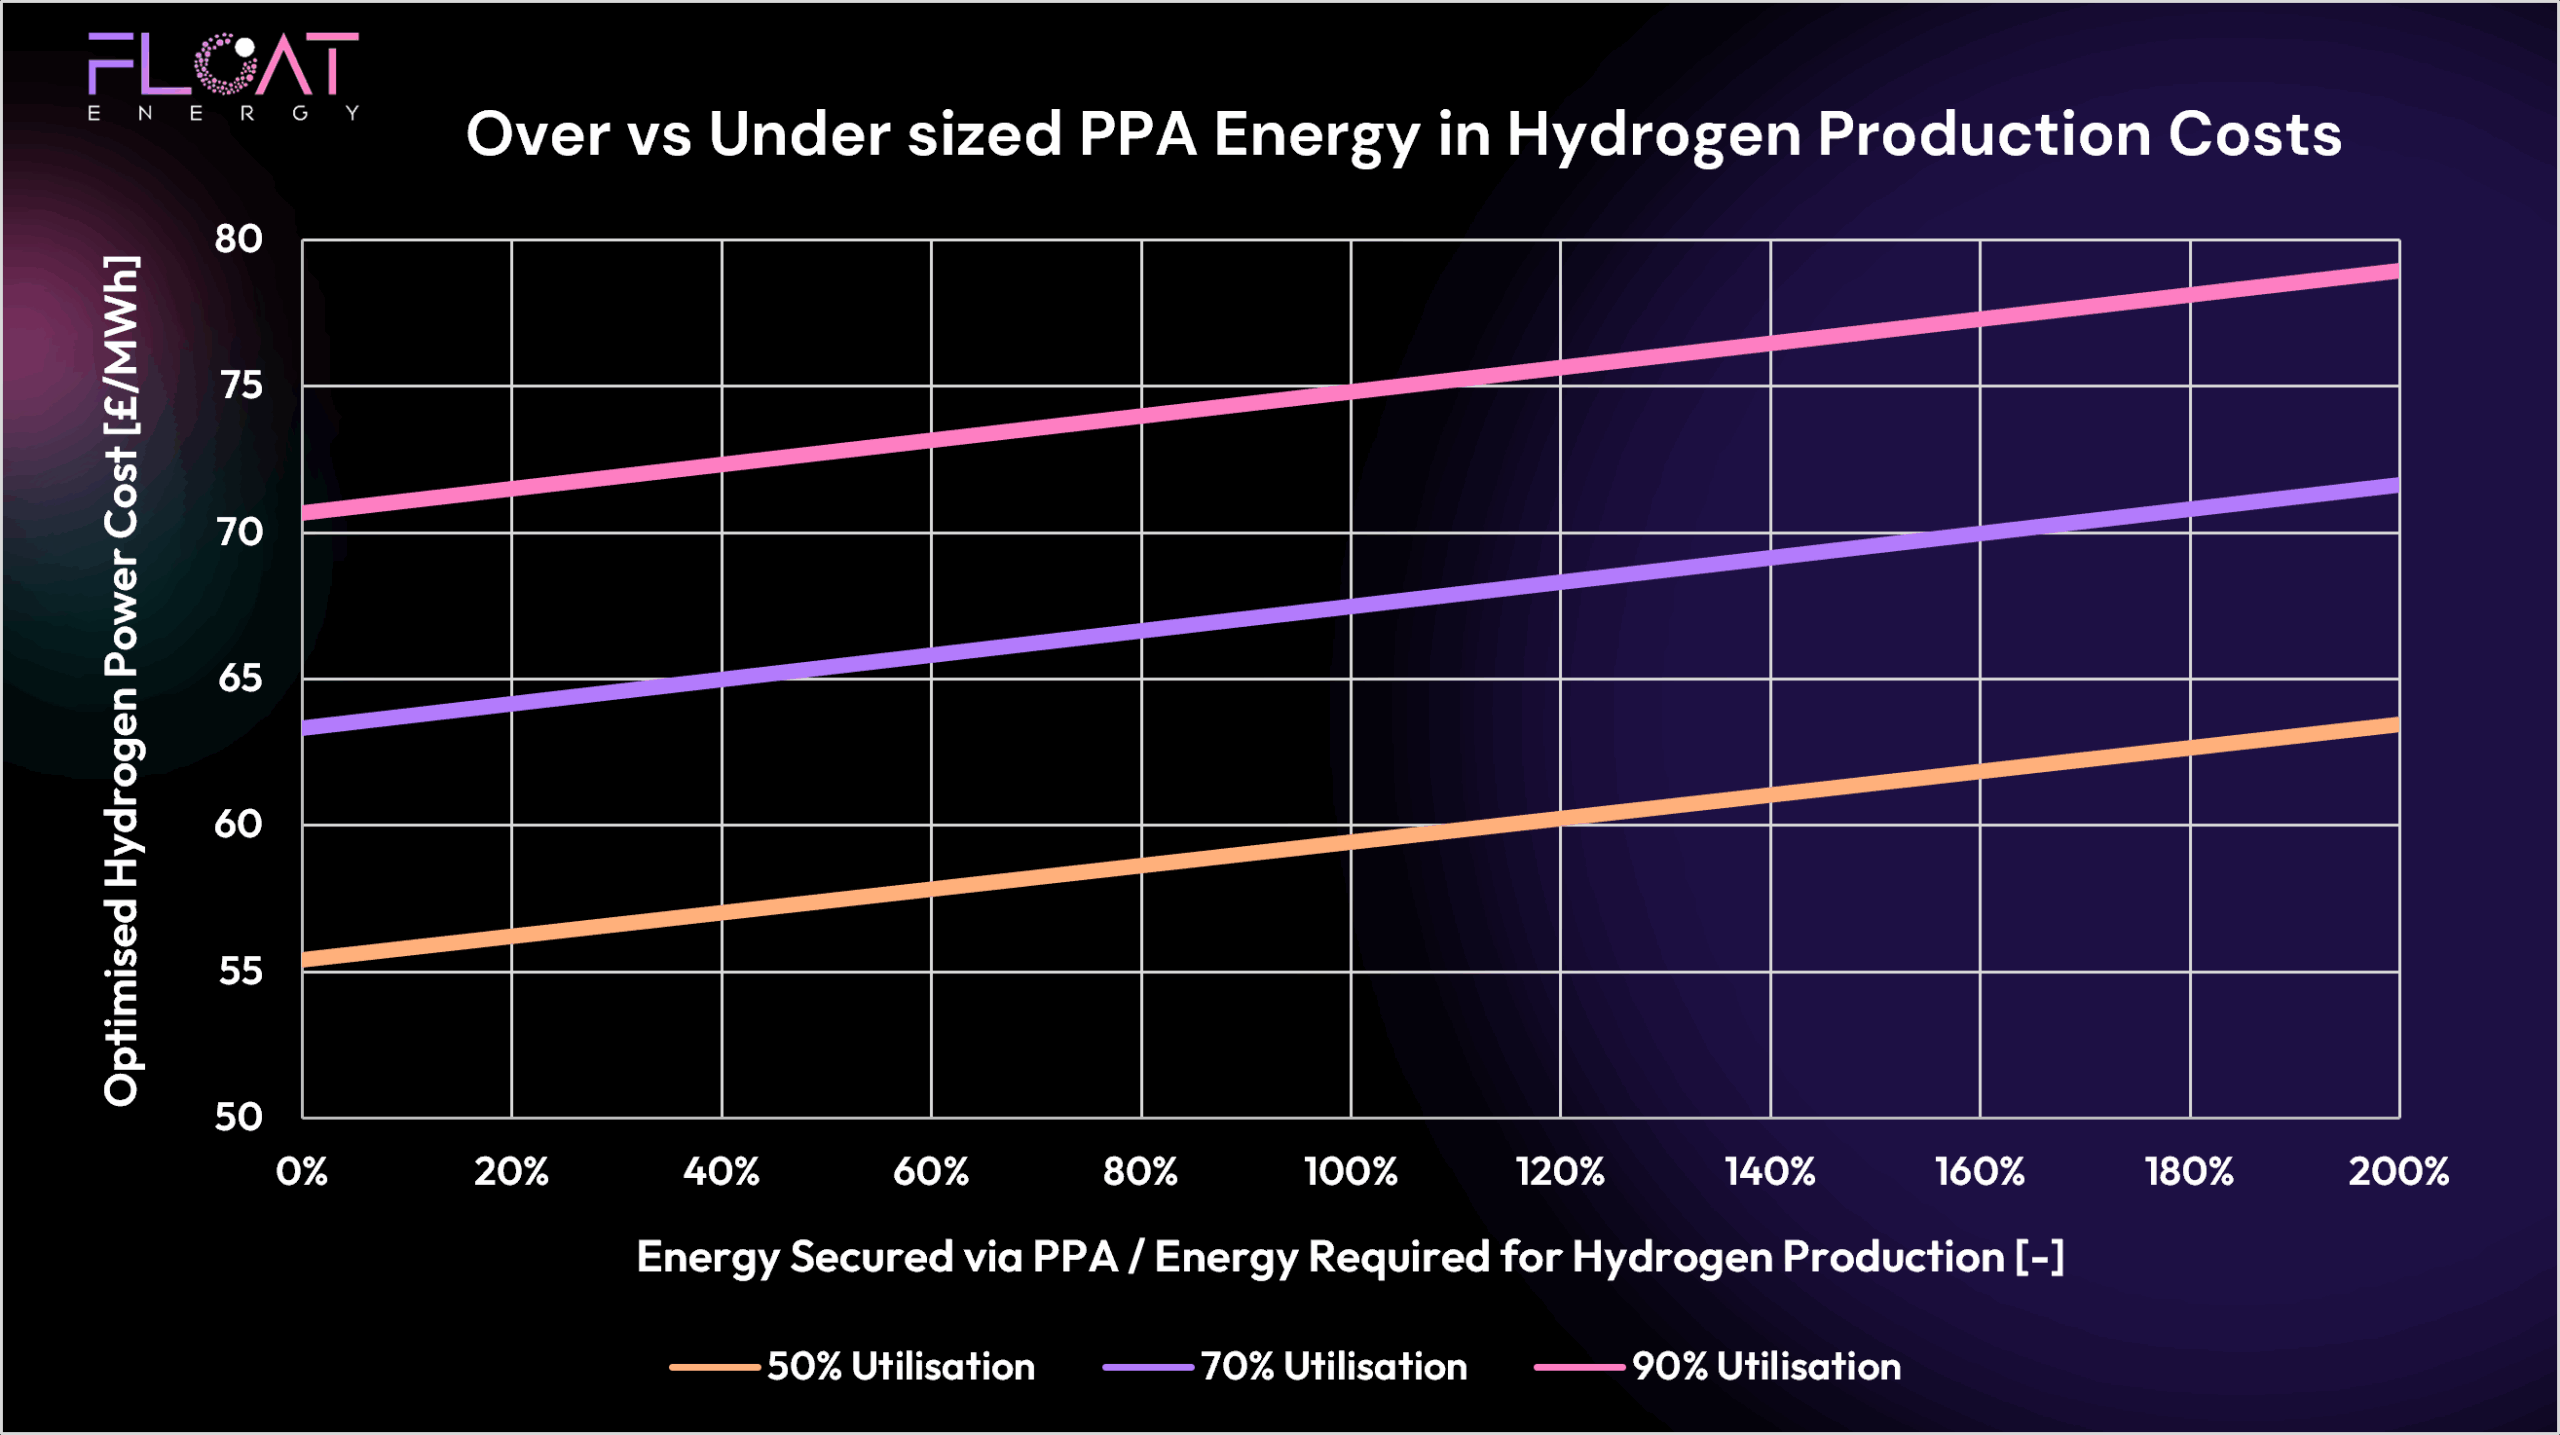
Where Do PPAs Fit Into This?
Although these monthly results focus on grid-exposed optimisation, PPAs remain an essential part of FLOAT’s overall optimisation strategy.
PPAs offer:
- Long-term price certainty, improving bankability
- Baseline compliance confidence through dedicated renewable supply
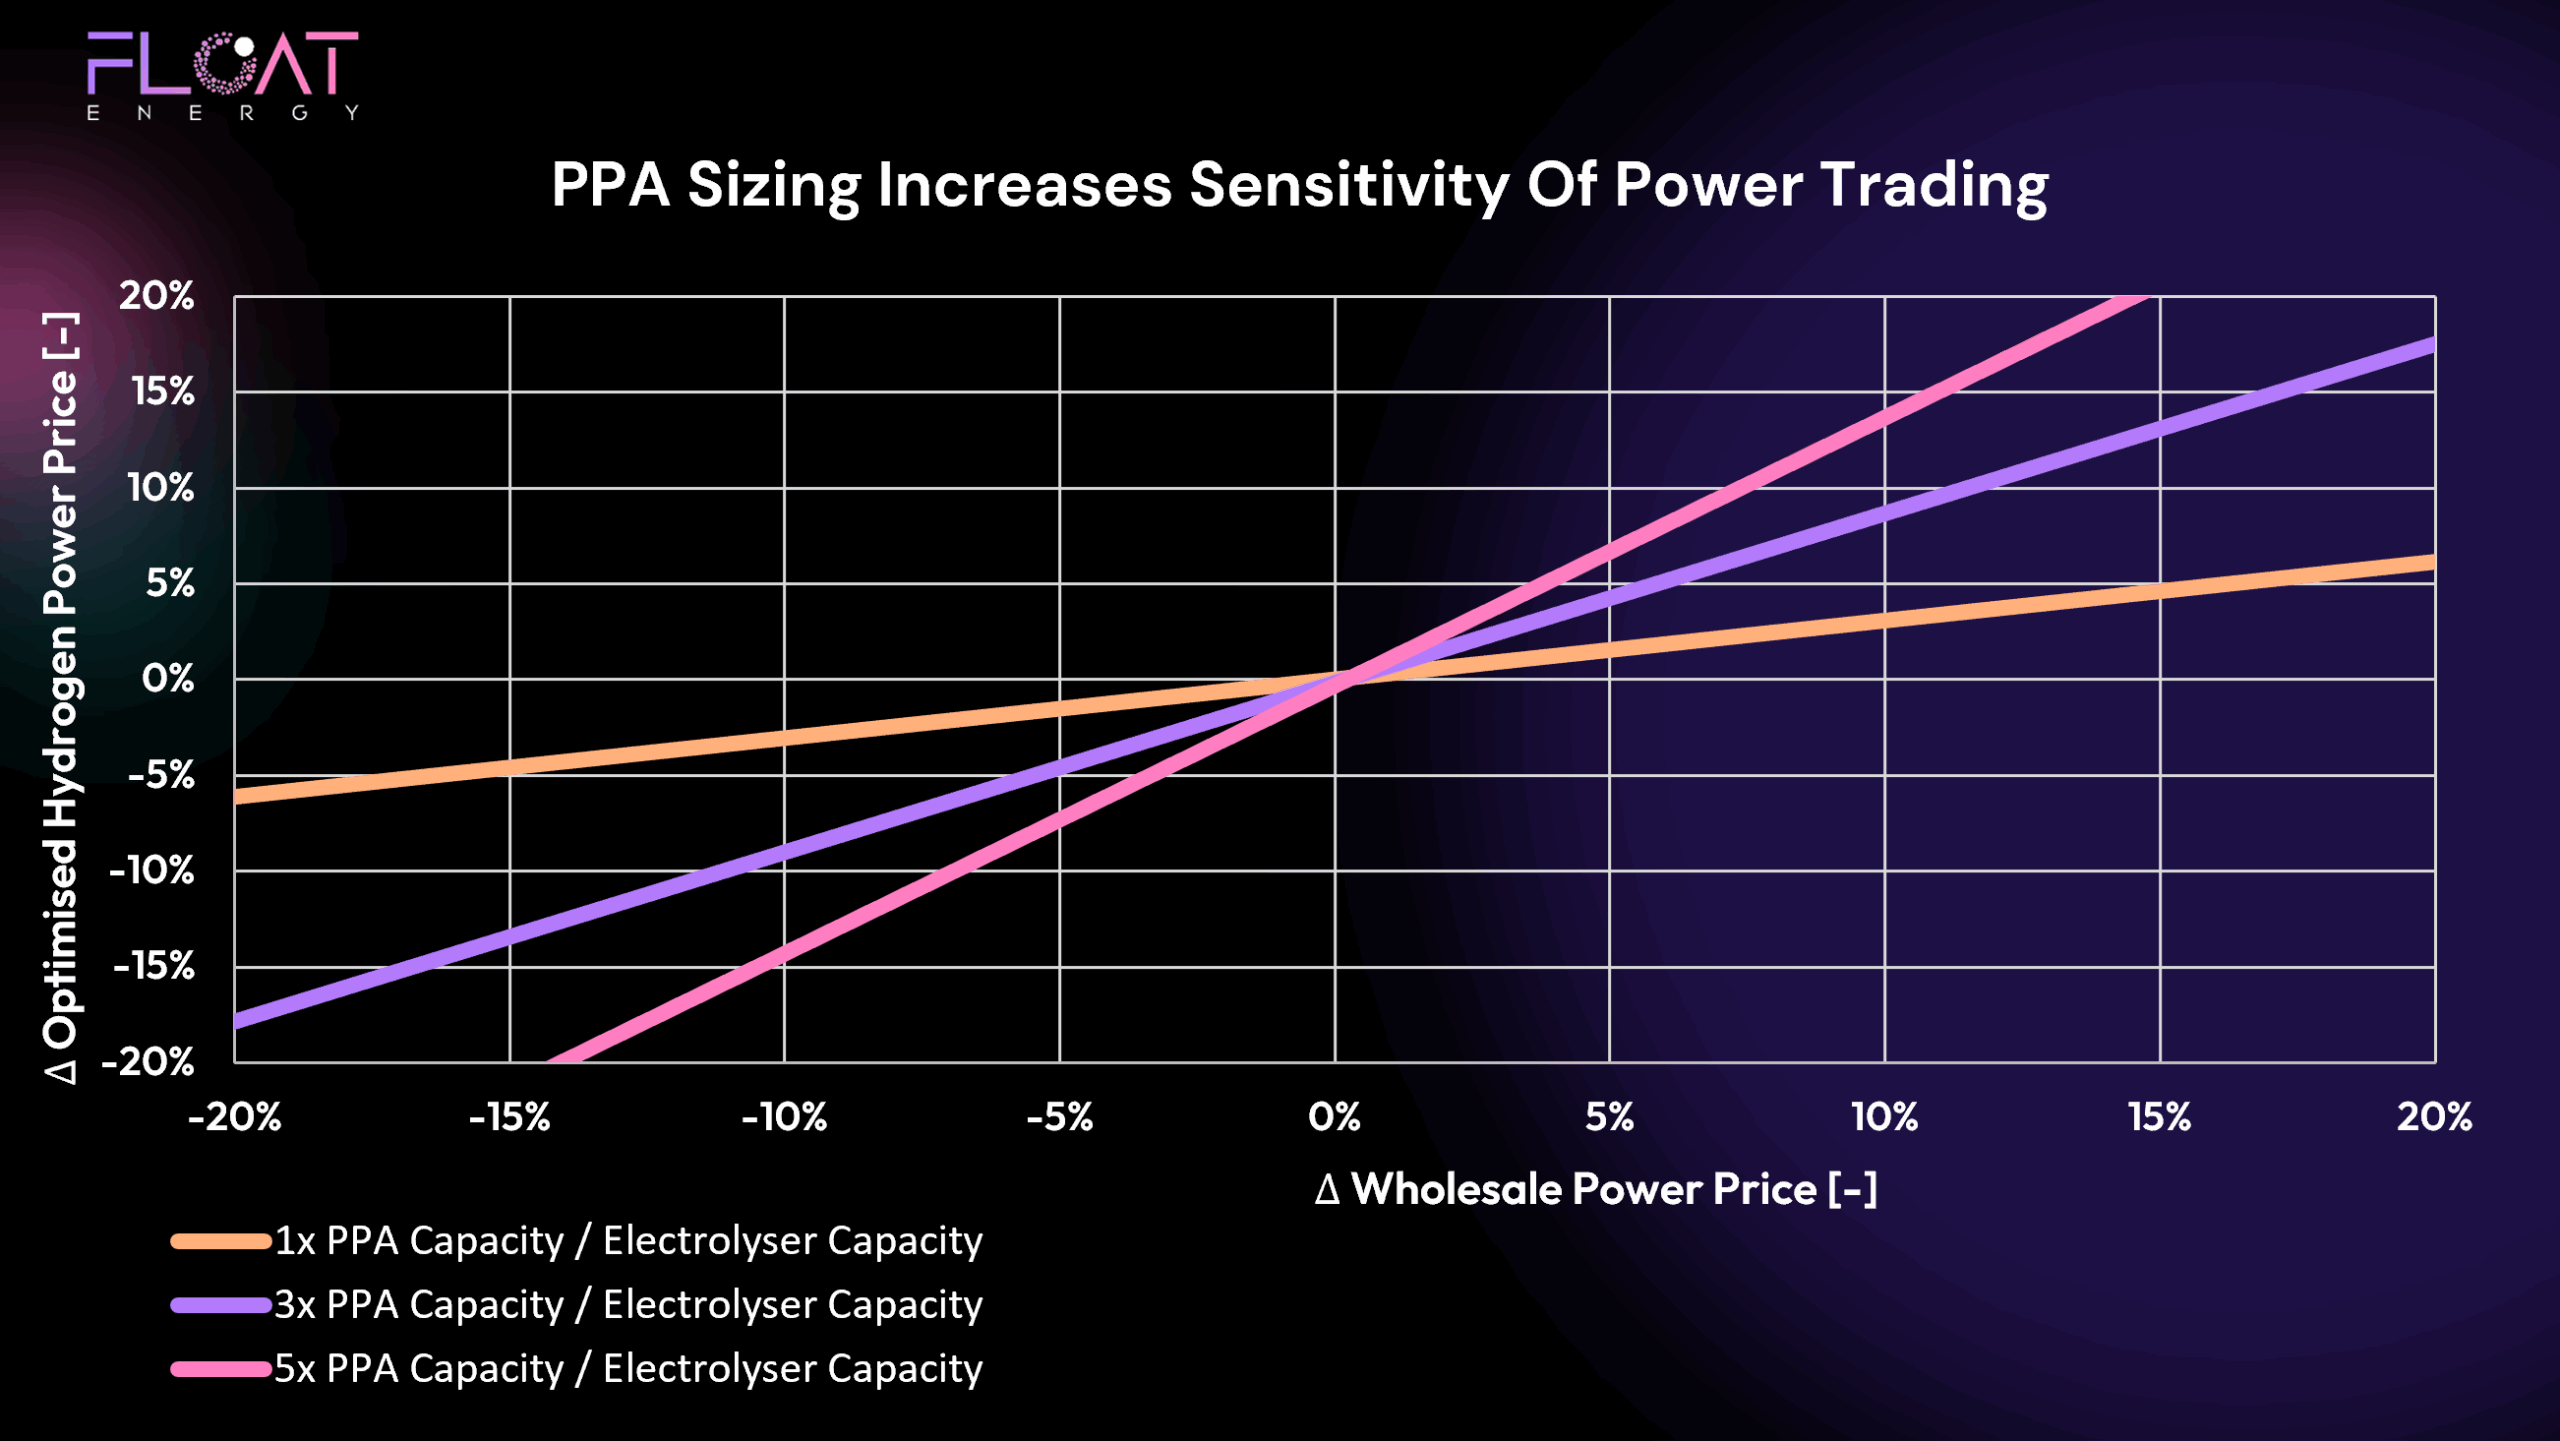
- Opportunities to optimise and trade surplus when market conditions allow
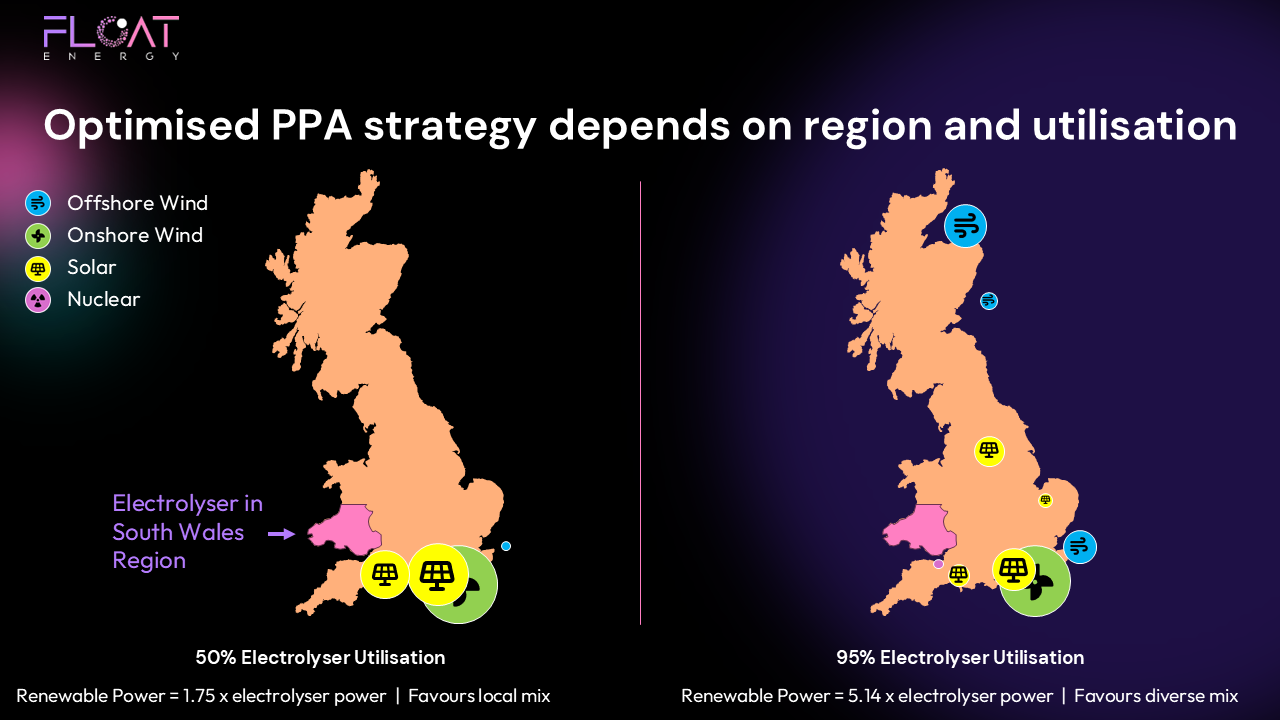
FLOAT supports clients in sizing PPAs appropriately during project development and maximising their value through trading strategies during operations. While these monthly results may not reflect PPA impacts directly, they are a critical tool in building resilient, bankable hydrogen projects.
Key Takeaways from March 2025
✅ Production costs fell through real-time optimisation
✅ Carbon compliance achieved without constraints
✅ Use PPAs and optimisation work together to deliver resilience and flexibility
Looking Ahead
As we move further into 2025, improving renewables and easing market tightness could create more opportunities for optimisation. FLOAT continues to focus on helping producers capture these benefits while managing long-term risks through smart procurement and operational strategies.
Ready to Optimise Your Hydrogen Strategy?
Whether you need help securing competitive PPAs, optimising trading strategies, or balancing both to deliver lowest-cost, compliant hydrogen, FLOAT’s optimiser is here to help.